


Marketing Cloud | Intelligence Reports
Intelligence Reports (formerly Datorama) for Marketing Cloud enables users to generate, view, and share a detailed analysis of Email data. See below for details on leveraging Intelligence Reports in your Marketing Cloud account. New to Intelligence Reports?
Passcode: Gh1&@m0I
Intelligence Reports Overview
- Assess data from the last 2 years
- Analyze data with built-in dashboards that visualize aggregated Email data
- View comparisons, trends, and patterns
- Filter, sort, and summarize data
- Share findings on a schedule
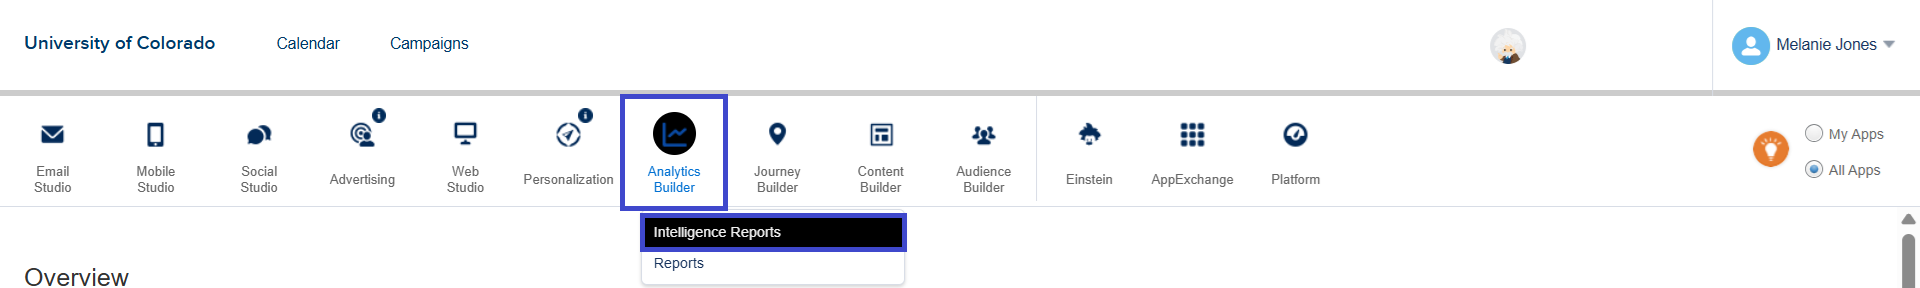
Navigate to Intelligence Reports
- Hover Analytics Builder
- Click Intelligence Reports in the dropdown
View Dashboards
- Once Intelligence Reports opens, the Dashboards tab opens by default.
- The available, built-in Dashboards are listed on the left side. Click the Dashboard name to display it.
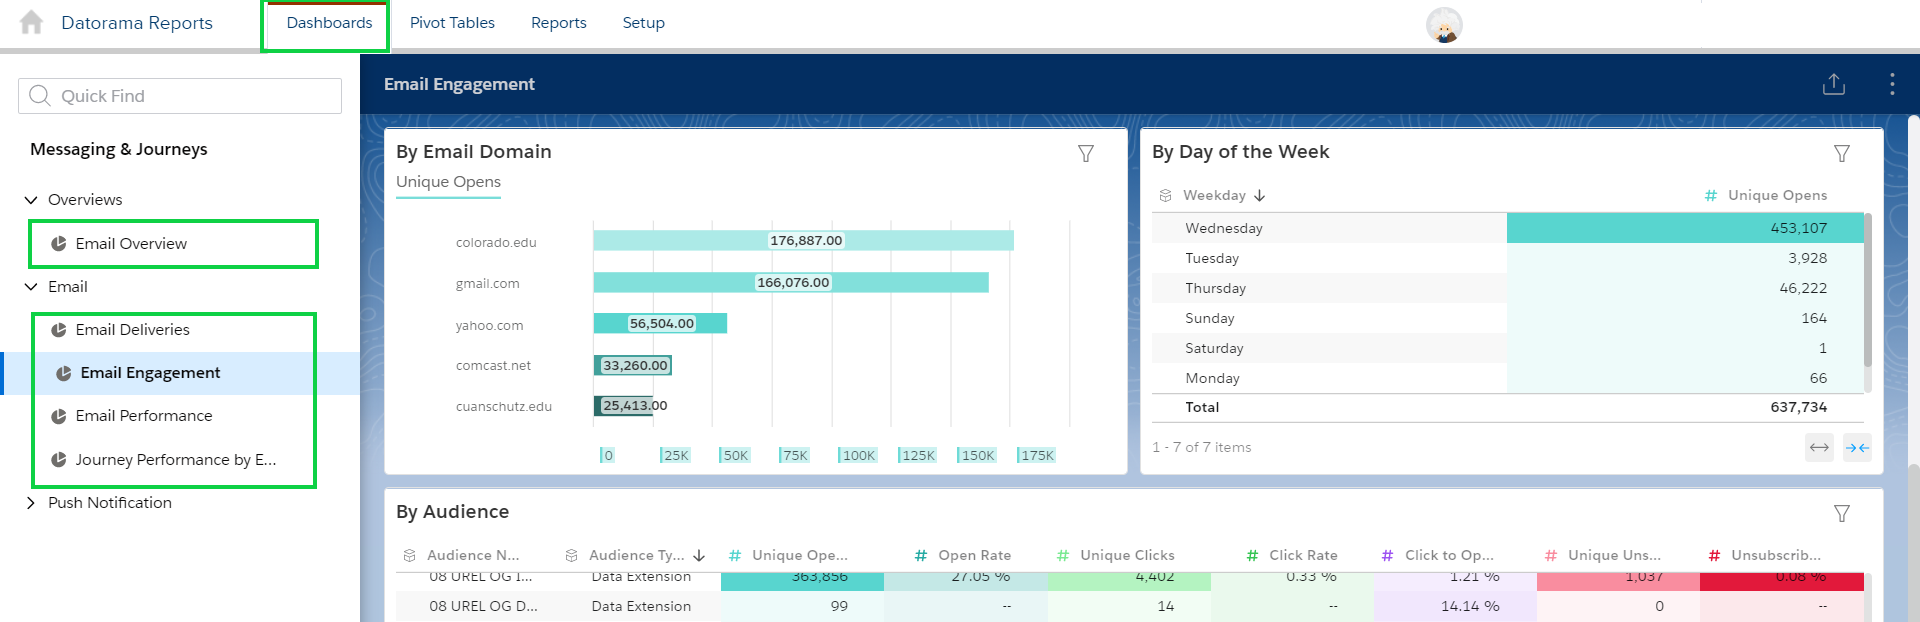
- Email Overview Dashboard | Get a high-level overview, such as the number of emails sent, the open rate, delivery and engagement, and the top- and bottom-performing journey emails.
- Email Deliveries Dashboard | View your email delivery data, including key performance indicators (KPIs) such as sends, deliveries and bounces, and delivery timelines.
- Email Engagement Dashboard | A detailed look into your email engagement key performance indicators (KPIs), including opens, clicks, unsubscribes, and engagement timelines.
- Email Performance Dashboard | Get details of your email send data, including the open rate, click rate, unsubscribe rate, and performance funnel.
- Journey Performance by Email Dashboard | Get an in-depth view into your email journey and activities performance data. It also provides a breakdown by domain, day of the week, and audience.
Dashboards cannot be customized. If you wish to change how the data is presented, create & customize a Pivot Table instead.
SHARE DASHBOARD PAGES & WIDGETS
- You can share dashboards and widgets via email or download as local files. You can also schedule when to share reports.
- Select the dashboard page or widget that you want to share.
- Click Share, and then click Email (or Download).
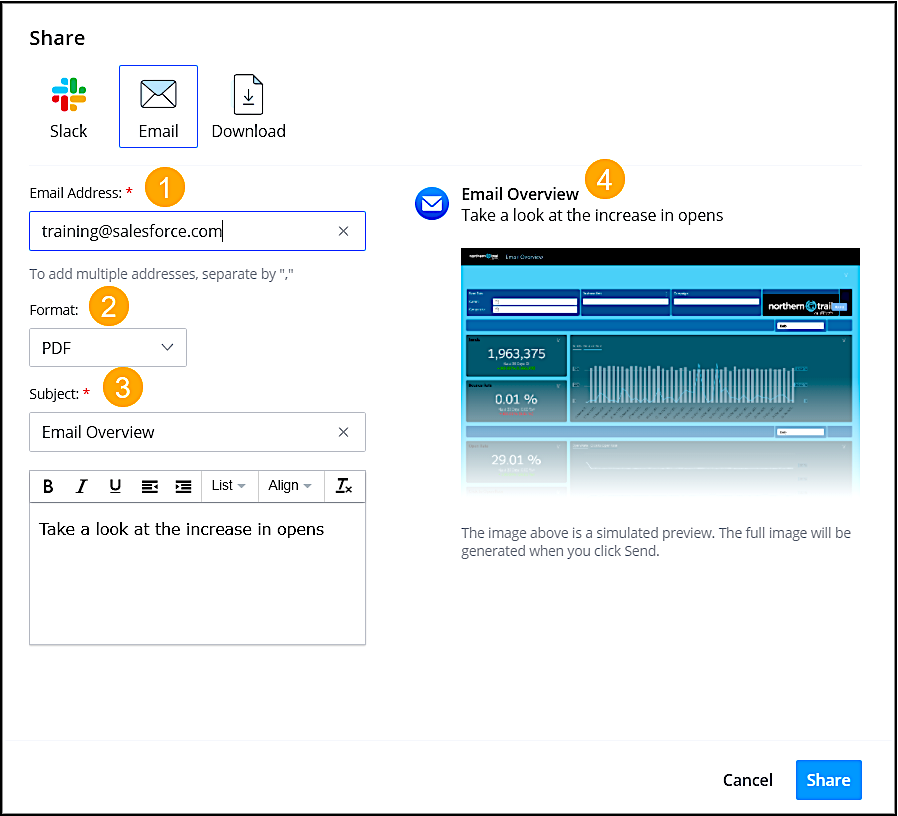
- Enter the recipient’s email address (1), and select the format (2). Enter the subject (3). The name of the dashboard or page is used by default. Preview what you’re sending (4).
- Click Send.
View & Create Pivot Tables
Pivot tables (unlike Dashboards) can be customized, allowing users to explore data from multiple perspectives.
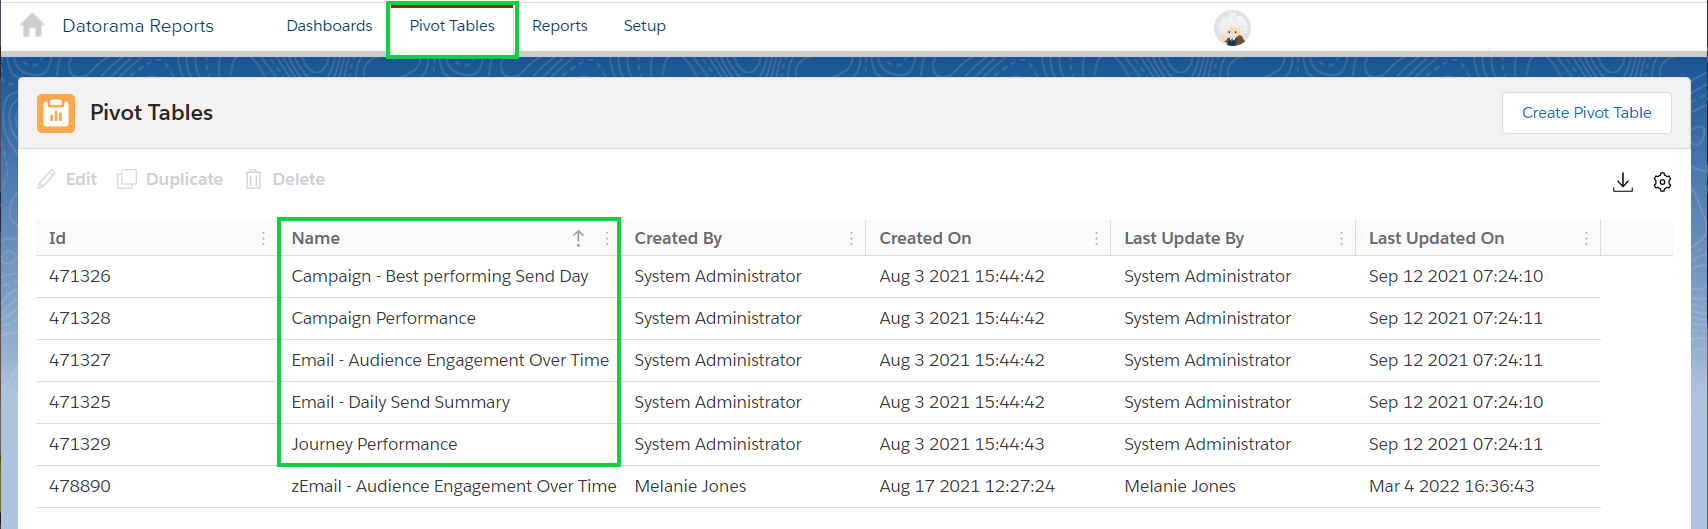
Available Pivot Tables
By default, Intelligence Reports for Marketing Cloud comes with five out-of-the-box pivot table examples. These examples help you get started so you can see how the most common pivot tables are configured and set up. You can use them as is or copy and then adjust them.
- Email Daily Send Summary — Summarizes your email send data so you can see how many emails were sent, delivered, and bounced for a specific time.
- Best Performing Send Day — This shows the send day that has the highest open rate, click-to-open rate, and email opens.
- Audience Engagement Over Time — See how your audience engages with your emails by looking at email clicks for all your campaigns.
- Campaign Performance — See your overall campaign performance for each campaign and email.
- Journey Performance — See your overall journey performance by looking at the journey name, version, and activity.
Create Pivot Table
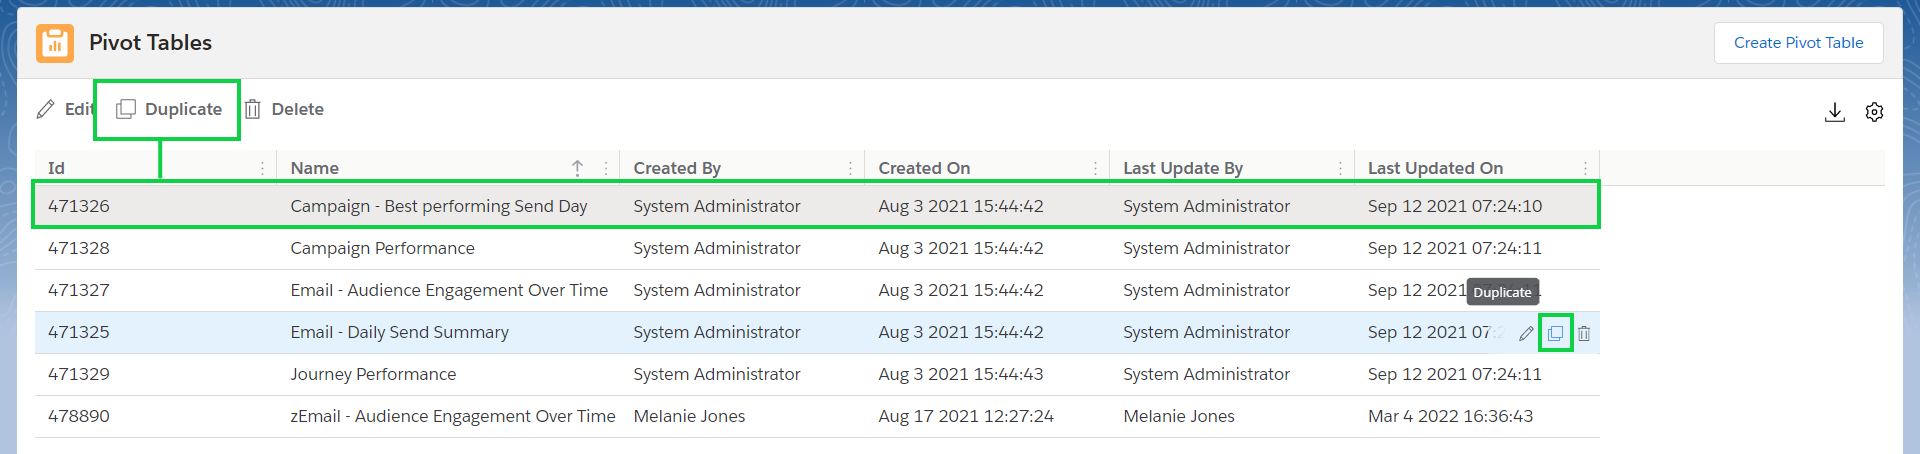
To duplicate a Pivot Table:
- Click the row of the Pivot Table you wish to clone.
- Select Duplicate in the top left
OR
- Click the Duplicate icon on the far right of the row.
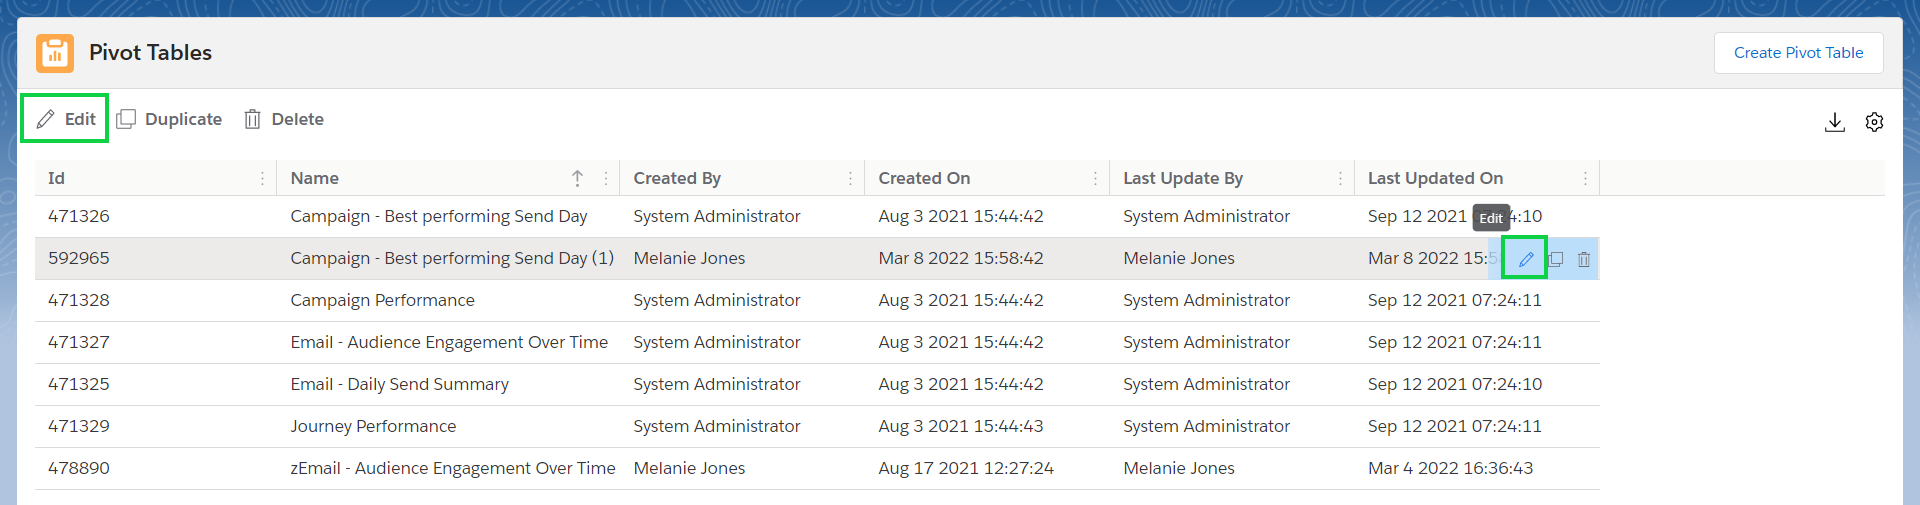
Once duplicated, edit the Pivot Table by:
- Clicking the row of the Pivot Table you wish to edit
- Selecting Edit in the top left
OR
- Click Edit pencil icon on the far right of the row
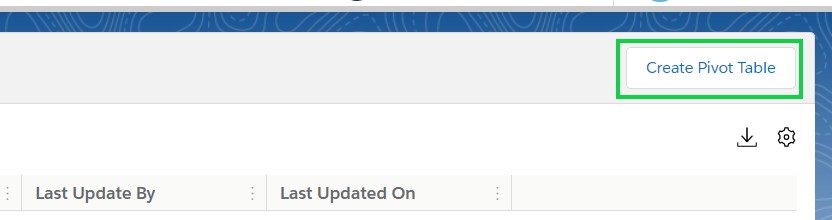
- Click the Create Pivot Table button in the top right
- Enter a name for the pivot table.
- Select the dates you want to pull data for.
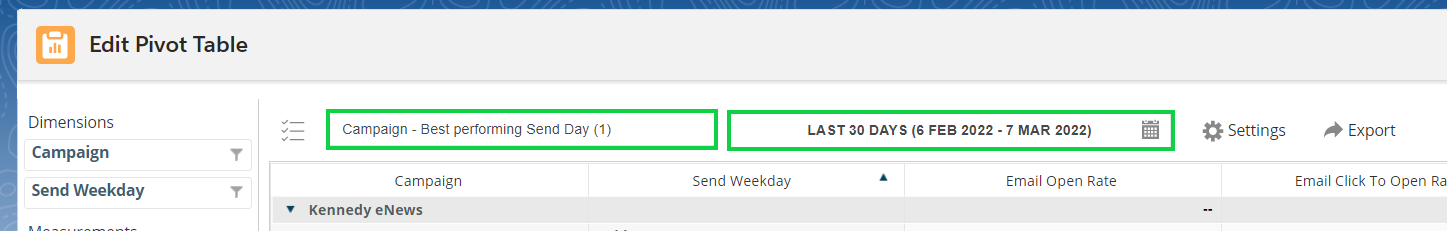
Customize Pivot Table
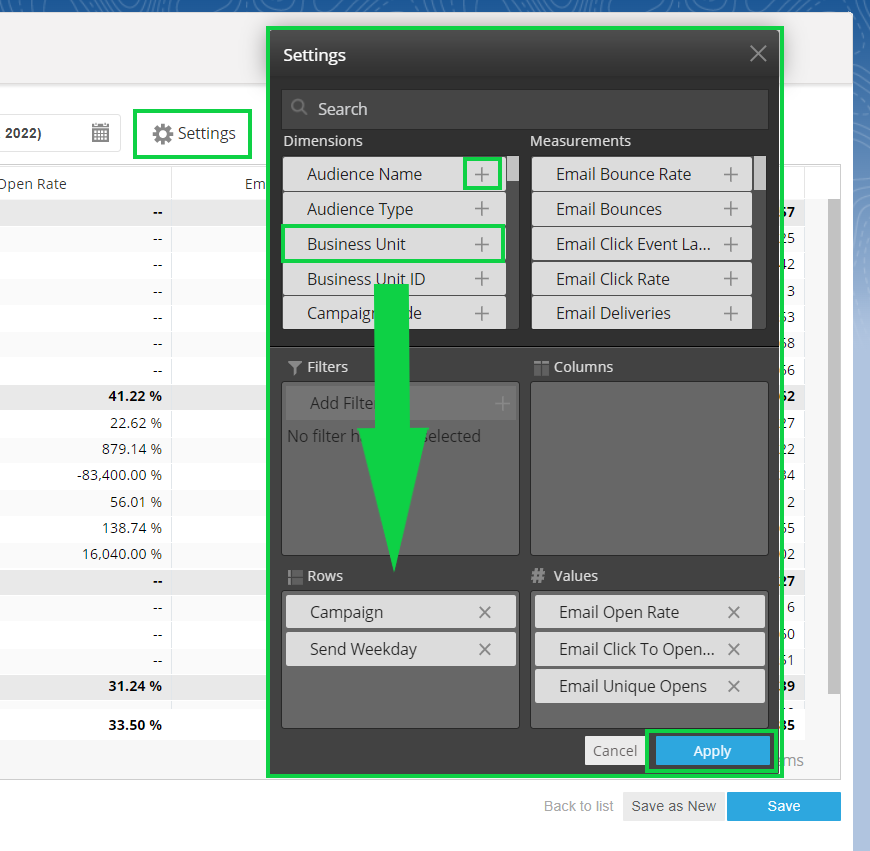
- To set up the pivot table, click Settings across the top.
- The Settings pop-up opens. You can resize, move it on the page, or close by clicking the X icon in the top right.
- Define the dimensions and measurements you want displayed in your columns and rows.
- You have a couple ways to complete this step:
- Select the dimension or measurement, and click the plus icon.
- Select the dimension or measurement, and then drag.
NOTE
- You can also define a filter to display emails that contain a specific string or specific value, or display all emails with an open rate of less than 10%. To learn more about filters, see the Apply Filters tab below.
- Click the blue Apply button in the bottom right.
- You'll see this reflected on the panel to the left of the pivot table preview.
- Save your changes with the blue button in the bottom right.
- Save as New is also an option.
TIP
- The most common error is reaching the maximum limit of 8,000 rows that you can present in the UI. If you receive this error, you have two options:
- To narrow down results, update your filter. For more information, see the Apply Filters tab below.
- Save the pivot table, and download the results.
After you create a pivot table, you can customize it so you can change the data that is displayed in the table, show or hide columns, and more.
To expand the left panel options, click  .
.
- To hide dimensions or measurements from the pivot table, click the dimension or measurement name.
- The name is dimmed to indicate that it’s hidden.
- If you applied a filter to a dimension or measurement and want to filter your table by a value within the selected dimension or measurement, click the Filter icon. Then change the selections.
- For example, select Email Name and filter by a specific email name.
- To hide the column totals from the pivot table, clear the Show columns total checkbox.
- To hide the row totals from the pivot table, clear the Show Rows Total checkbox.
- Select how you want to display the dates: period name, period first day, or period first day of calendar.
To apply the changes, click Apply.
Filters narrow down the data shown and focus on what’s relevant to your use case. For example, add a filter to a pivot table to focus on a specific email name instead of all the emails in the business unit.
There are three different types of filters:
- Dimensions — Filters by a dimension.
- Custom dimensions — Filters by a customized dimension. For example, filter by an email name that contains the characters “CUvsUNC”
- Custom measurements — Filters by a customized measurement. For example, filter by email bounce rate that is over 60%.
To filter data in a pivot table or report, you can add a filter.
- Click Add Filter.
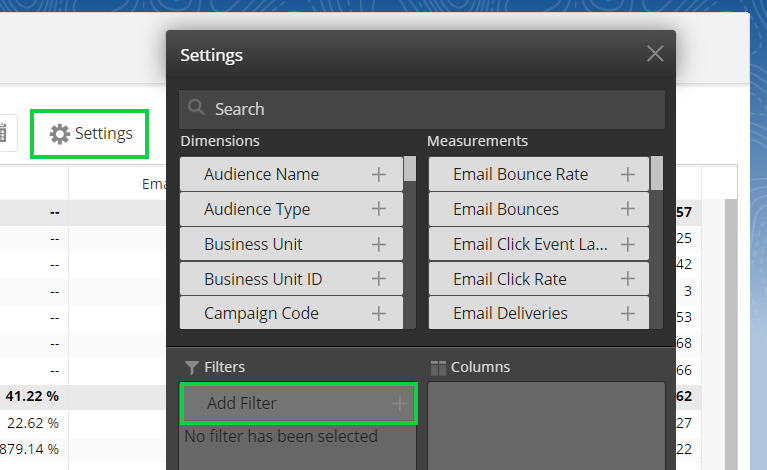
- To add a dimension:
- Select Dimensions.
- Search for the required dimension, and select the value.
TIP To add a filter to exclude test emails, search for the Test Email Indicator dimension, and then set it to False. After you do, test emails don’t appear in your pivot tables or reports.
- To add a custom dimension, for example, if you want to filter by an email name that contains the characters “CSvsUNC”:
- Select Custom Dimensions.
- Select the dimension from the dropdown list, choose the operator from the dropdown list, and enter the value in the field.
- To add a custom measurement, for example, if you want to filter by emails with a click-rate over 5%:
- Select Custom Measurements.
- Select the dimension from the dropdown list, choose the operator from the dropdown list, and enter the value in the field.
I
- To apply the filter, save your work.
You can manage pivot tables in Intelligence Reports for Marketing Cloud after you create them.
Edit — If you want to change a pivot table, for example, change the dimensions and measurements.
Duplicate — If you want to create a copy of a pivot table to change it.
Delete — If you want to delete a pivot table.
Export a Pivot Table
After you create and customize your pivot table, you can export it. You can export directly to a report format, which can be set to run as part of a workflow, in real time, or according to a defined schedule. Or you can export to an Excel format, for example, if you want to share the pivot table with others.
- Click Export.
- Select the export option you require:
- Schedule Export — If you want to export to a report, you have two options. The report format and options change according to the format you select.
- Pivot Table (Excel) — Exports the pivot table into an Excel file as a pivot table object. Doesn’t include totals.
- Flat Table — Creates a report in an Excel format.
- Export — If you want to export to a flat file., you have two options:
- Pivot Table (As Is) — Exports your pivot table to an Excel file as is.
- Flat Table — Exports your pivot table to an Excel file in the form of a flat table.
- Schedule Export — If you want to export to a report, you have two options. The report format and options change according to the format you select.
Create & Schedule Reports
You can create a report when you want to retrieve, view, and share a detailed analysis of your data. You can create a report from scratch or export an entity like a pivot table or dashboard page to a scheduled report. Reports can be in these formats:
- Flat Table (Excel/CSV) — Creates a flat file with the data. For example, display the total number of sends per send date.
- Pivot Table (XLS) — Creates an Excel in the same structure as your pivot table view.
- Dashboard (PDF) — Exports a dashboard into a PDF.
Create a Flat Table Report
You can create a flat table report when you want a report that extracts your raw data into a CSV or Excel file.
- Select the Reports tab.
- Click Create New Report.
NOTE You can also create the same report from the Pivot Table module by using schedule export as a flat table.
- Define your General details.
- Enter a Name.
- Select the Export Format: CSV or Excel.
NOTE The configuration settings change according to the format type you select. For example, if you select CSV, not all the fields are available.
- Define your Configuration details:
- To determine the dates you want to pull data from, select the Time Period. You can use a predefined time period, such as week, month, or year, or you can define a custom date.
- In Measurements, select the measurements you want pulled into the report, for example, email sends. You can select up to 100 measurements.
- In Dimensions, select the dimensions you want pulled into your report, for example, send date. You can select up to 80 dimensions. NOTE For a detailed explanation of the metrics available, see Dimensions and Measurements.
- Customize your report in the Configuration settings area:
- To include the total numbers in the report, select the Show Totals checkbox.
- From the Sort By dropdown, search for and choose the dimension or measurement you want to sort the report by. You can choose from any of the selected dimensions or measurements.
- From the Sort Order dropdown, select the way you want to sort, either descending or ascending order.
- To add another filter to your report, click Add Filter. For example, you can also filter by Campaign Name. For more information about filters, refer to Apply Filters.
- Define scheduling and delivery methods for the report. Refer to Define Scheduling and Delivery Methods.
Create a Pivot Table Report
To export a report to an Excel file or display the data in a pivot table, you create a pivot table. The pivot table isn't a real Excel object, rather it appears only in the form of a pivot table. You can also create a pivot table report by exporting a pivot table to a scheduled report.
NOTE Most of the report configuration settings are self-explanatory or have a tooltip available in the platform.
- Access the Intelligence Reports for Marketing Cloud, select the Reports tab.
- Select the Reports tab.
- Click Create New Report.
NOTE When creating the report from scratch, you must link to an existing pivot table. The configuration settings come from the pivot table, so any changes made to the source affect the configuration settings of the report later on.
- For General details, name the report and select Export Format: Pivot Table.
- To define your report configuration details, select the time period from which to pull data.
- Specify when and how to deliver the report.
Create a Dashboard Report
You can create a dashboard report in PDF format. You can also create a dashboard report by exporting a dashboard page. When creating the report from scratch, you must link to a dashboard page. The configuration settings come from the dashboard page, so any changes made to the source affect the configuration settings of the report later on.
- Select the Reports tab.
- Click Create New Report.
- Define your General details.
- Enter a Name.
- Select the Export Format: PDF.
- To determine how long reports are kept before they’re deleted, enter the Purge Report History (Days). For example, if you enter 30, all reports are deleted after 30 days.
NOTE By default, the number of days is set to 180, which is also the maximum number of days you can keep reports.
- Define your Configuration details, and select the dashboard page for which you’re creating the report.
- Define scheduling and delivery methods for the report. Refer to Define Scheduling and Delivery Methods.
Data Details
With Intelligence Reports for Marketing Cloud you can see how many emails or messages were opened, delivered, and clicked but doesn’t display subscriber-level data. The data that is displayed is daily aggregated metrics. For example, you can see the number of send and open rates per day, during the last 90 days, for a specific campaign.
Important Information about Data in Intelligence Reports
- Data retention — The first time you activate Intelligence Reports for Marketing Cloud, up to 90 days of historical data is available. From that point on, historical data is retained for 2 years.
- Data refresh — Data is refreshed every 24 hours. Each account has its own time for daily refresh, and it can’t be set.
- Data retrieval — If a failure in data retrieval from Marketing Cloud to Intelligence Reports occurs, the process retries every few hours. Any other data is reprocessed the following day. Such failures are monitored internally. The user isn’t notified of an error. However, even with an error, users can keep using Intelligence Reports for Marketing Cloud and retrieve reports based on existing data.
- Data deletion — When you delete a contact record for one or more subscribers within Marketing Cloud, personal information for those contacts is removed from Intelligence Reports for Marketing Cloud within 90 days.
- Time zone — Daily data is presented (aggregated) according to the time zone set in your enterprise’s business unit settings. All business units that belong to the enterprise reflect the enterprise’s time zone.
Available Data Elements
There are two types of data elements available:
- Dimensions — Qualitative non-numerical data that you can't count, for example campaign name and campaign ID.
- Measurements — Quantitative numerical data that you can count, for example, number of clicks and emails opened.
For a full list of all the measurements and dimensions that are available, see Dimensions and Measurements.