


Marketing Cloud | Einstein Overview
Einstein for Marketing Cloud uses artificial intelligence (AI) to help you analyze, automate, and optimize your marketing activities and content. With Einstein, you can use valuable insights and data on audiences, send time, engagement, and copy to improve your marketing communication efforts.
You might be asking, what's the difference between Einstein and Intelligence Reports (formerly Datorama)? While Intelligence Reports focuses on reporting and can drill down into specific email sends and determine the success of a particular effort, Einstein uses AI to make marketing recommendations based on generalized subscriber engagement and behavior trends.
There are various features available through Marketing Cloud Einstein, including:
- Einstein Engagement Scoring
- Einstein Messaging Insights
- Einstein Send Time Optimization
- Einstein Engagement Frequency
- Einstein Copy Insights
How Can Marketing Cloud Einstein Help?
- Discovers insights that bring new clarity about your constituents.
- Predicts outcomes to make decisions with confidence.
- Recommends the best actions to make the most out of every engagement.
- Automates routine tasks so you can focus on constituent success.
Salesforce Resources
Navigating Marketing Cloud Einstein
After Marketing Cloud Einstein has been enabled in your Business Unit, view insights by navigating to Einstein in the main navigation bar, where you'll see all the various Marketing Cloud Einstein features listed. Please note it can take up to 72 hours for the data to process and be available to view after Einstein has been enabled in your Business Unit.

The Einstein Overview dashboard will give you a high-level summary of the insights from the various Einstein features. From the overview dashboard, you can also navigate to the other dashboards by clicking on Go to... at the bottom of each widget.

You can hone in on the details of a specific metric in all of the Einstein features dashboards by clicking View Details, located at the bottom of the widgets.

Click on the information icon next to the title of a widget to read a description of what is being measured.

Einstein Engagement Scoring
Einstein Engagement Scoring uses constituent data and machine learning to generate predictive models that assign scores for every contact's likelihood to engage with emails. Einstein Engagement Scoring aggregates constituent data in a dashboard that provides audience-level insights.
Constituents are grouped into the personas listed below based on predicted email engagement:
- Loyalists: Subscribers with high open and click engagement
- Window Shoppers: Subscribers with high open and low click engagement
- Selective Subscribers: Subscribers with low open and high click engagement
- Winback/Dormant: Subscribers with low open and click engagement

Individual contact-level scores populate in the data extension named Einstein_MC_Predictive_Scores. Find the engagement scoring data extension by going to Email Studio > Subscribers > Data Extensions > Einstein_MC_Predictive_Scores. Do not use this Data Extension for sending emails.
Data Input:
- Emails sent from your business unit and your subscribers' engagement with those messages.
Data Output:
- Likelihood to Open, Click, Unsubscribe.
- Each engagement prediction tile displays:
- Activity Prediction: Average likelihood for each engagement metric over the next 7 days
- Change vs Last Week: Change in the average prediction week over week
- Audience Health Indicator: Assessment of audience health for each engagement metric benchmarked against email and mobile industry standards
- Model Confidence Indicator: Relative predictive strength of your subscriber engagement scores
Use Cases:
- Segment your subscriber list to identify and target specific audiences based on their engagement likelihood.
- Use the feature to identify an unengaged audience and launch a "win-back" or "we miss you" campaign.
Constraints:
- A minimum of 1 email send from the Business Unit is required for a contact to have engagement prediction scores.
- It can take up to 90 days to generate initial scores, but engagement scores are typically available 24–48 hours after Einstein is activated.
Salesforce Resources
Einstein Messaging Insights
Get guidance on marketing performance with Einstein Messaging Insights. Receive alerts in your Marketing Cloud account via the notifications badge in the header when an anomaly occurs. Click on an alert to navigate to the insights hub for more information related to the anomaly.
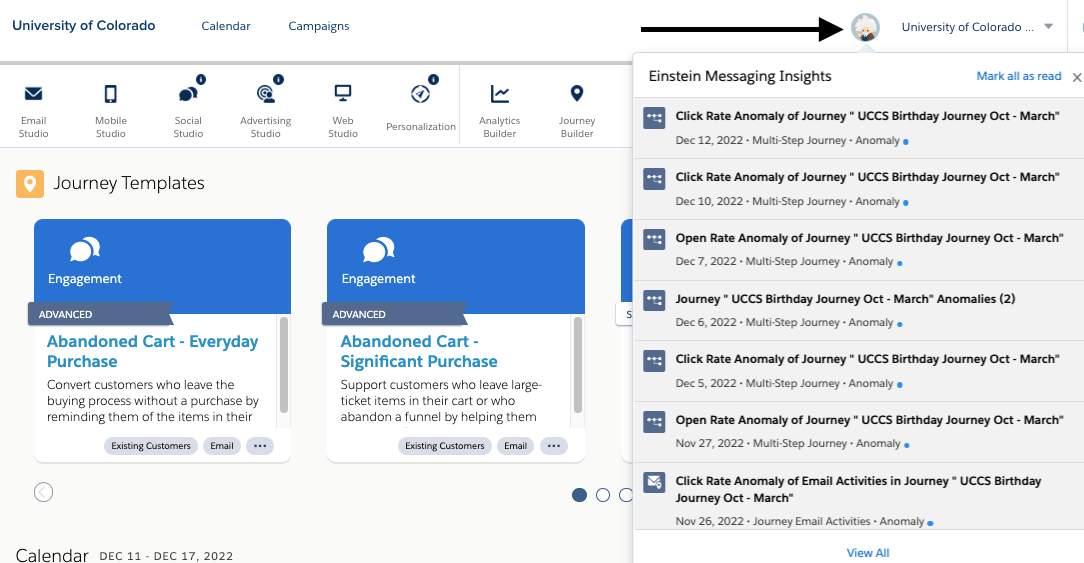
You can also navigate directly to the Messaging Insights Dashboard via the Einstein drop-down.
Click on an insight to view contributing factors that influenced the email's performance. Note: Top Contributed Factors are not available for journey insights.
Journey Insight Example

Email Insight Example

Data Input:
- The variables that Einstein measures to provide insights include open rate, click rate, and unsubscribe rate.
- For batch sends, Einstein uses a group of similar sends from within the last 90 days to calculate the average performance of a variable.
- For journey sends, Einstein uses up to 90 days of performance data to measure the rolling average performance of a variable. This average is used as the expected value for the variable that's measured.
Data Output:
- Notifications when Email Open, Click, or Unsubscribe Rate anomalies are detected.
- Top Contributing Factors and signal strength (the level of likelihood that the factor influenced the anomaly). These insights are not available for journey sends.
Use Cases:
- If you get an anomaly that a specific message had high or low engagement, determine the top contributing factors and make adjustments for future communications.
Constraints:
- A minimum of 10 email batches from the Business Unit is required to model for batch insights.
- A minimum of 7 days of history for the journey in the Business Unit is required to model for journey and journey activity insights.
Salesforce Resources
Einstein Send Time Optimization
Einstein Send Time Optimization (STO) uses machine learning and 90 days of engagement data to determine the optimal send times by day and/or hour based on when a user is most likely to engage with your message. STO can be used to determine the best day/time to send an email on the individual contact level in a journey, aggregated for all contacts in a data extension, and for all contacts in a business unit.

Data Input:
- Subscribers' engagement with email messages sent from all business units within the enterprise within the past 90 days.
Data Output:
- The optimal time to send an email to a subscriber.
Use Cases:
- Use the Einstein Send Time Optimization dashboard to view optimal send times for all email addresses or contacts in a business unit.
- View the optimal send time for a data extension before you send.
- Increase overall engagement for a journey; add an STO activity before each email in the journey. STO can be combined with a Wait Activity (ex., Wait 3 days ——> STO ——> Send email)
Salesforce Resources
Einstein Engagement Frequency
Einstein analyzes email send and engagement data from the last 90 days to decide on the optimal number of emails to send to your contacts. The Einstein Engagement Frequency dashboard will show how saturated your contact base is based on their last four weeks of engagement. The primary intended use for Einstein Engagement Frequency is the Frequency split activity in Journey Builder. The Frequency split activity is designed for marketers to send the optimal number of emails to subscribers in their business unit, increasing engagement and reducing subscriber email fatigue.

Data Input:
- Subscribers' engagement with email messages sent from a single business unit within the past 90 days.
Data Output:
- The saturation level of each active subscriber and an overall Business Unit-level ideal frequency band.
Use Cases:
- Use Frequency activity within Journey Builder to determine how many emails a contact should receive for optimal engagement. This could be especially useful for giving campaigns.
- View the saturation levels at a high level for all contacts in the Business Unit. Remember, data is aggregated at the Business Unit Level, so this is not a complete picture of saturation.
Constraints:
- A minimum of 10 subscribers is required to model for engagement frequency.
- A minimum of 5 frequencies over a 28-day period is required to model for engagement frequency. In other words, the audience in your business unit must receive 5 emails over a 28-day period to model for engagement frequency.
IMPORTANT Einstein Engagement Frequency data is aggregated at the Business Unit level, so it is not a complete picture of saturation as contacts will likely be receiving emails from other Business Units.
Salesforce Resources
Einstein Copy Insights
Einstein Copy Insights reviews up to 90 days of rolling email engagement data, analyzes the performance, and returns insights on how to make your subject lines more impactful to increase engagement.

Data Input:
- The data input for Predicted Subject Line Performance includes subject lines sent from all business units and subscriber engagement within your enterprise and all other enterprises opted into global models within the past 90 days.
- The data input for Langage Analytics and Insights include subject lines sent from a single business unit within the past 90 days.
Data Output:
- The data output for Predicted Subject Line Performance includes the predicted open rate range and most likely open rate.
- The data output for Langage Analytics and Insights includes subject lines and 1-, 2-, or 3- word phrases sorted by performance or send volume; language factors and AI-identified emotional tones correlated with their impact on performance.
Use Cases:
- Review positive or negative impacts and how much they mattered to the subject line's engagement rates.
- View top performing and most frequently used phrases.
- Sort best-performing subject line copy by engagement rate or the number of emails delivered.
- Find out how your message's subject line is likely to influence message performance with the Subject Line Tester tool; test the performance of a single subject line or compare up to 10 subject lines and use the one with the highest predicted performance.
How to Use the Subject Line Tester Tool:
Find out how your message's subject line is likely to influence message performance. Test the performance of a single subject line or compare up to 10 subject lines. Navigate to the Performance Tester widget within the Einstein Copy Insights dashboard. Enter a subject line in the text field to test a single subject line or select 'Compare Subject Lines' to test and compare the predicted performance of up to 10 subject lines.

IMPORTANT Predicted performance factors and guidance are unique for each subject line that you test. Don't generalize the guidance or use it as a standard for best practices.
Salesforce Resources
How to Get Started
Diving into Einstein for the first time can feel overwhelming. To assist, follow along with the recommended phases below to continually learn and apply more complex areas of Einstein.
- Send Time Optimization (STO)
- Copy Insights
- Subject Line Insights
- Engagement Frequency
- Engagement Scoring
- Messaging Insights
Related Content
- Compare Salesforce & Marketing Cloud Data
- Marketing Cloud Tracking
- Intelligence Reports Overview
- Marketing Cloud | How-to Use Intelligence Reports
- Salesforce Email Send Data & Aggregate Link Level Details
- Salesforce Individual Email Results (IERs) & Individual Link Level Details
- Measuring Email Marketing Effectiveness