


Explore key metrics for PSC services, including volume and cycle time for purchase orders and contracts, as well as volume information for accounts payable, service desk, and operations. Additionally, there are general metrics on system volume, procurement spend, and Knowledgebase utilization, covering data from all campuses. For campus-specific information, reporting requests, and access to the your campus-specific dashboard please contact pscbusinessintelligence@cu.edu.
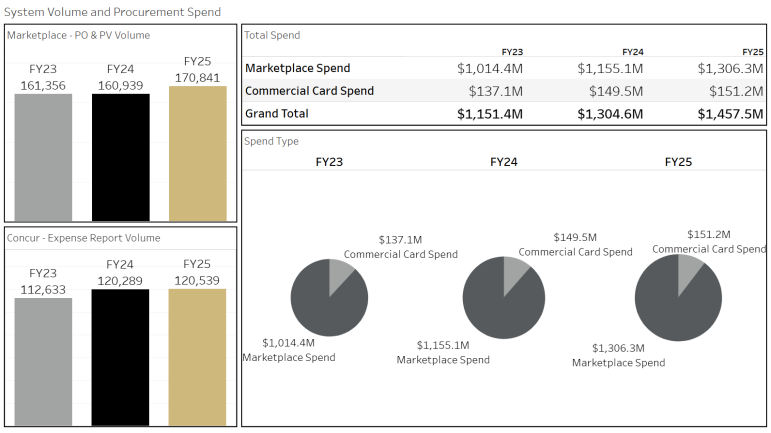
System Volume and Procurement Spend
System (Marketplace and Concur) Volume & Total Spend* – FY23 - 25
System Volume
- Marketplace - Purchase Order and Payment Voucher Volume - 6.2%
- Concur - Expense Report - 0.2%
Procurement Spend
- Marketplace Spend - 13.1%
- Commercial Card Spend - 1.1%
- Overall Spend - 11.7%
Both systems have been consistently maintained and continue to function effectively, ensuring they meet the University’s needs and remain operational.
*Spend calculated on paid invoices for each fiscal year.
Click image to zoom
Click here for the System Volume and Spend dashboard (to view you must be logged into your campus VPN).
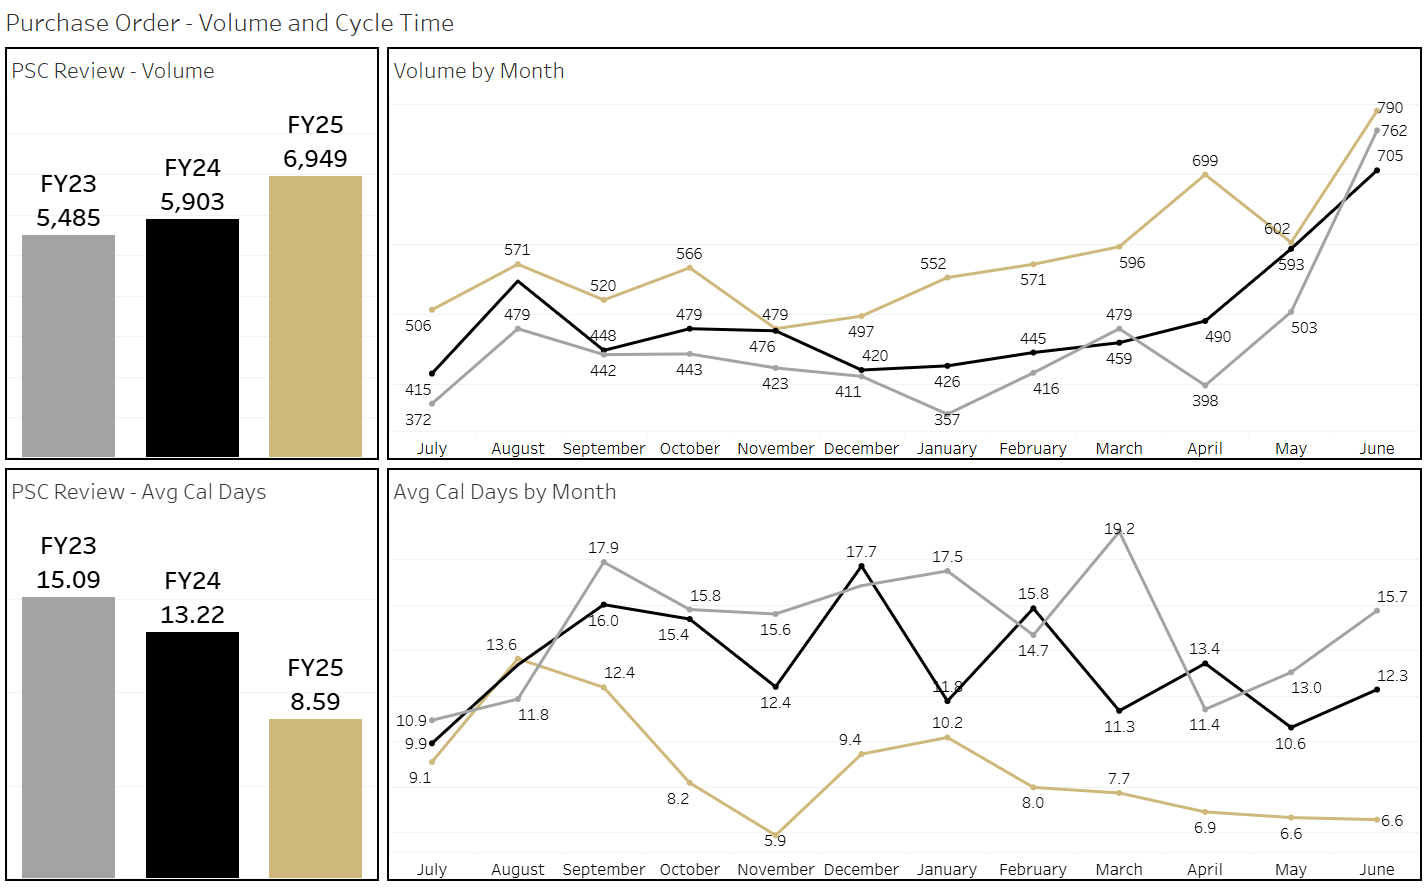
Purchase Order
Volume & Cycle Time for PO’s reviewed by PSC - FY23-25
Overall
- Volume - 17.7%
- Cycle Time* - 35%
Purchase Request Form Launch (Nov-June)
- Volume - 19.2%
- Cycle Time* - 41.6%
By Category
| Category | Volume | Cycle Time |
|---|---|---|
| IT | 26.5% | 18.8% |
| Prof Svc/Other: | 9.7% | 42.9% |
| Scientific | 26.5% | 50.7% |
*Cycle times are calculated from when a requisition reaches the Purchasing Agents queue to when a PO is issued.
Click here for the Purchase Order Volume & Cycle times dashboard (to view you must be logged into your campus VPN).
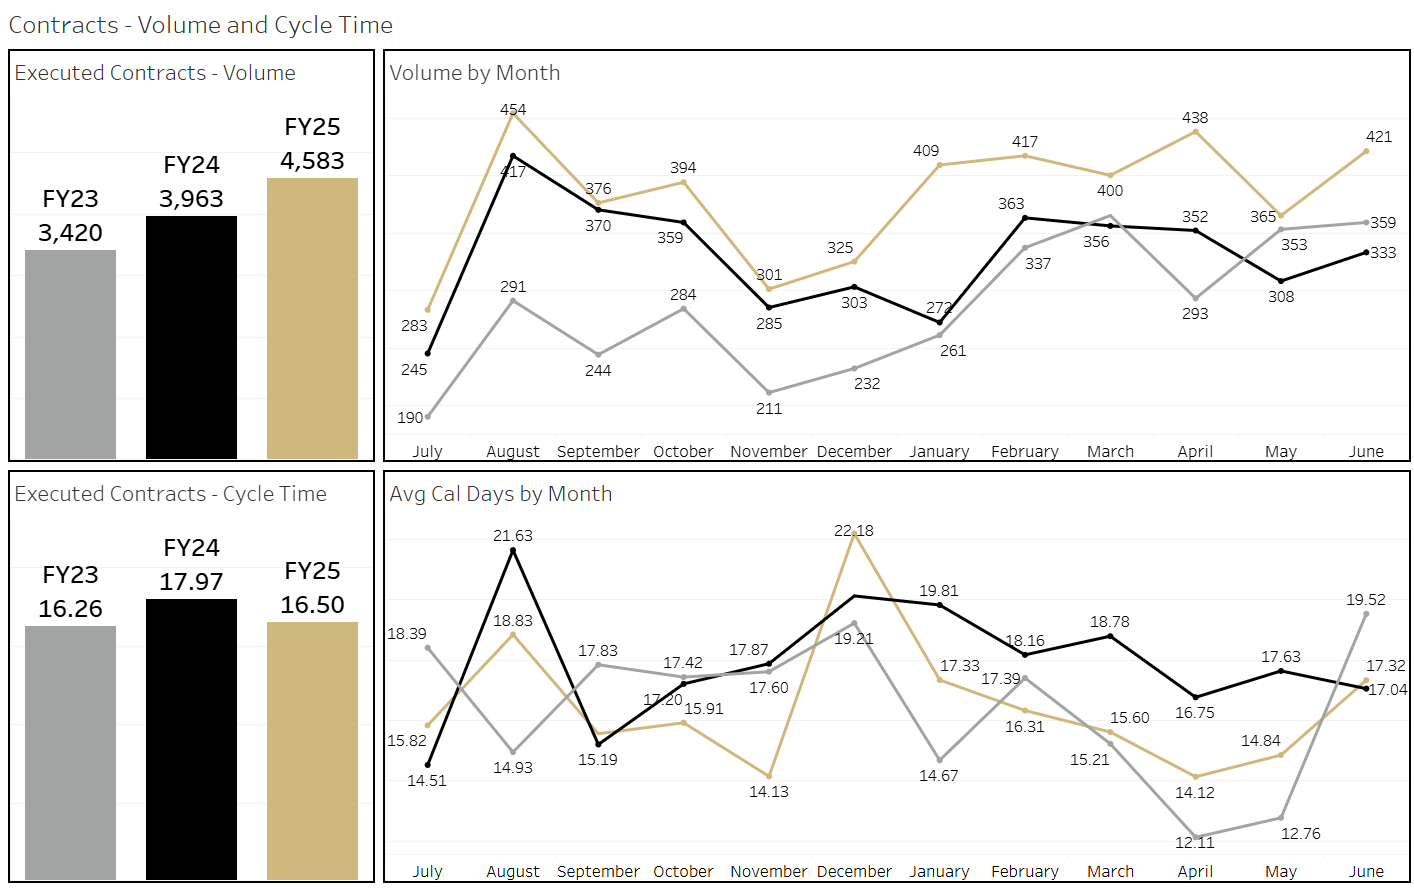
Contracts
Volume and Cycle Time for Contracts - FY23-25
Overall
- Volume - 15.6%
- Cycle Time - 8.2%
By Category
| Category | Volume | Cycle Time |
|---|---|---|
| IT | 18.7% | 10.1% |
| Prof Svc/Other: | 10.3% | 18.7% |
| Scientific | 30.5% | 31.7% |
Click here for the Contracts Volume & Cycle times dashboard (to view you must be logged into your campus VPN).
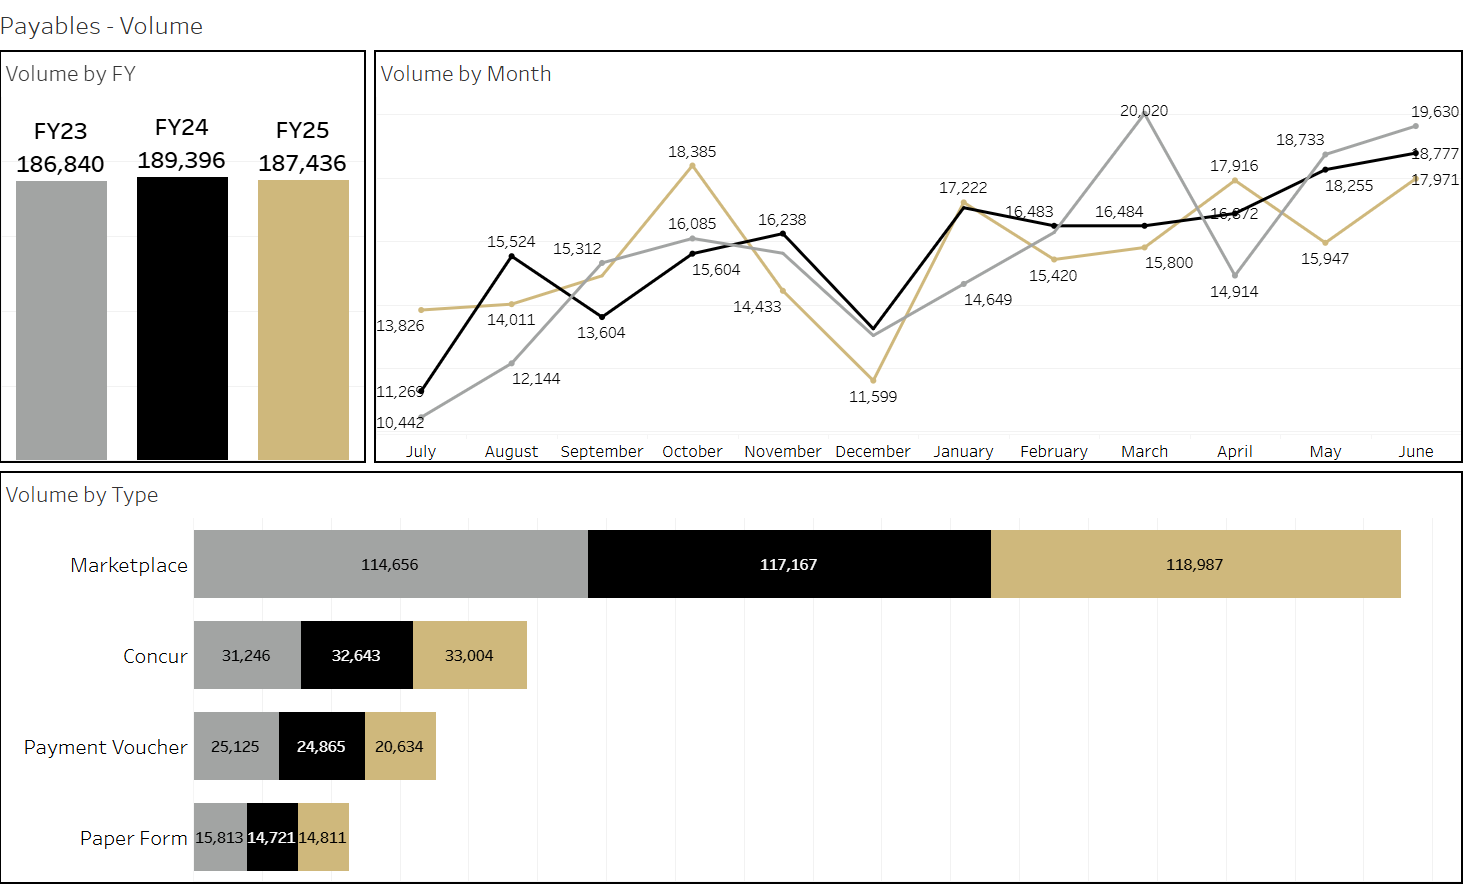
Payables
Manually Processed Invoice Volume by Type - FY23-25
Overall Volume - 1.0%
By Type
| Area | Volume Change |
|---|---|
| Marketplace | 1.6% |
| Concur | 1.1% |
| Payment Voucher* | 17.0% |
| Paper Form | 0.6% |
*Payment Voucher volume reduced because of an automated process launched in mid-February 2025
Definitions:
- Marketplace – Processed PO/SPO invoices
- Concur – Approved reimbursement, refund, and/ or travel card expense reports
- Payment Voucher – Approved payment vouchers submitted in Marketplace
- Paper Voucher – Processed Payment Authorization (PA), Non-Employee Reimbursement-International (NRI), and Study Subject Payments (SSP) forms
Click here for the Payables Volume dashboard (to view you must be logged into your campus VPN).
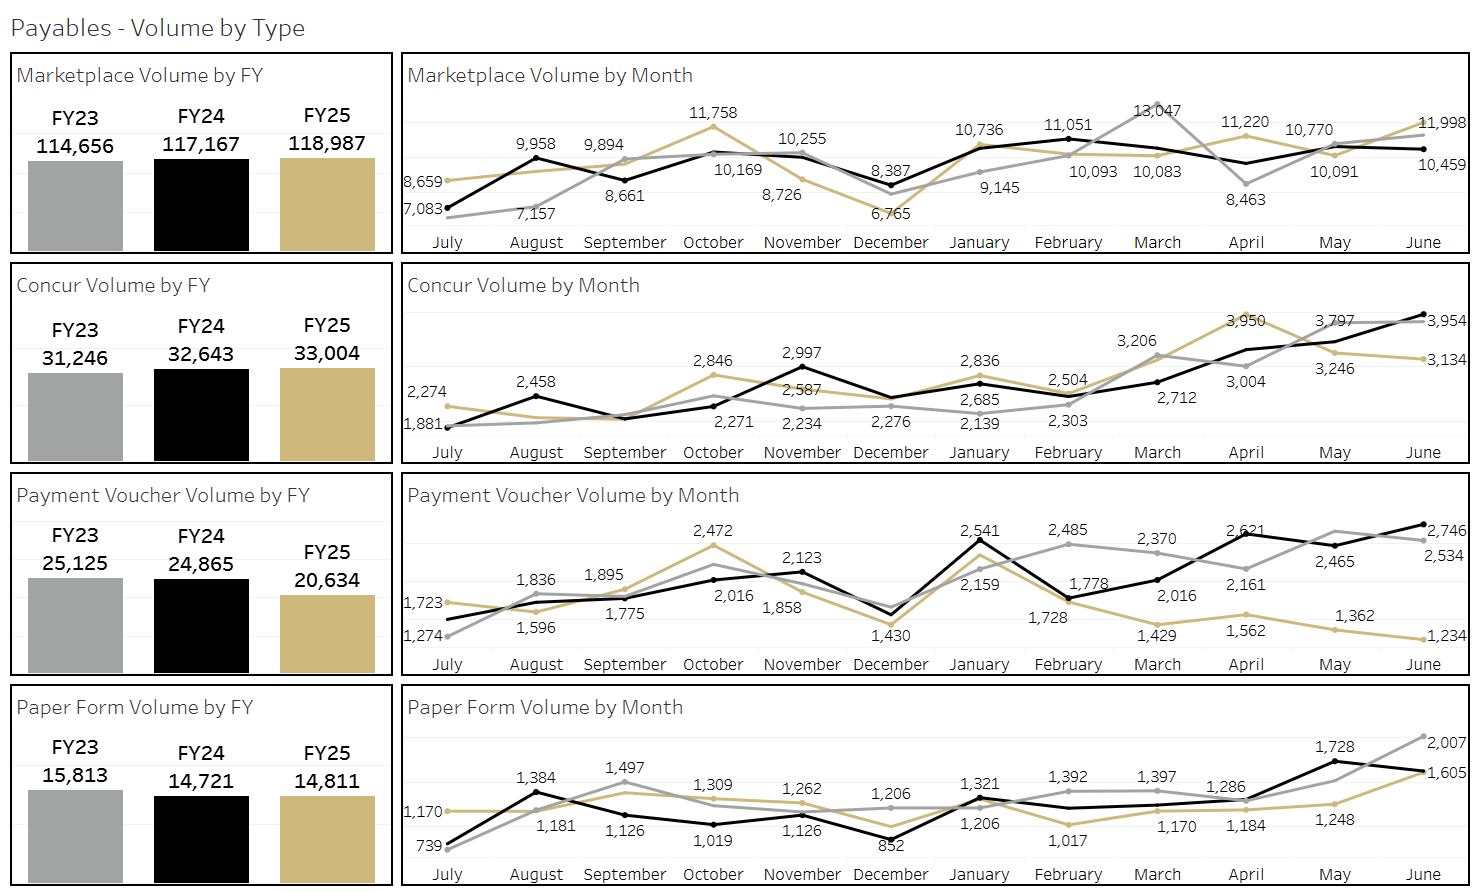
Click here for the Payables Volume by Type dashboard (to view you must be logged into your campus VPN).
Service Desk and Operations
Completed Service Desk and Operations Volume by Type - FY23 - 25*
Overall Volume - 7.1%
By Type
| Area | Volume Change |
|---|---|
| Customer Experience | 14.2% |
| CU Supplier | 3.4% |
| Change Order | 0.8% |
*Salesforce was officially implemented in August 2022. As a result, FY23 volume data encompasses the period from August 2022 through June 2023.
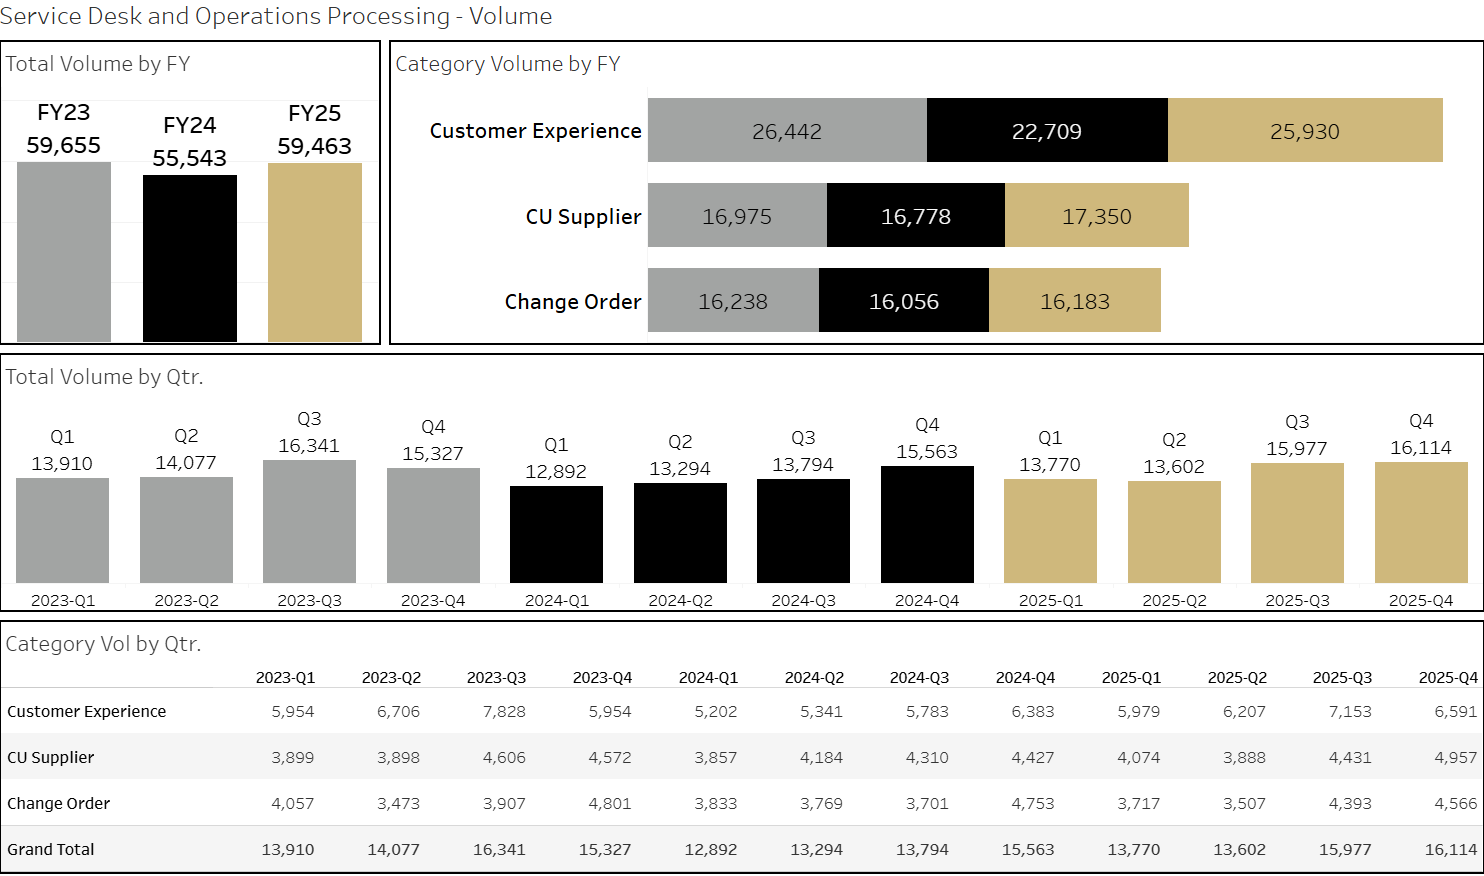
Click here for the Service Desk dashboard (to view you must be logged into your campus VPN).
Knowledge Base (KB)
Knowledge Base in FY24-25*
- Average 18k views per month
- Number of articles by the end of FY25: 381
Over the course of FY25 the PSC released over 100 articles referring customers "How to Buy".
*Go live for Public KB was Aug 21, 2024
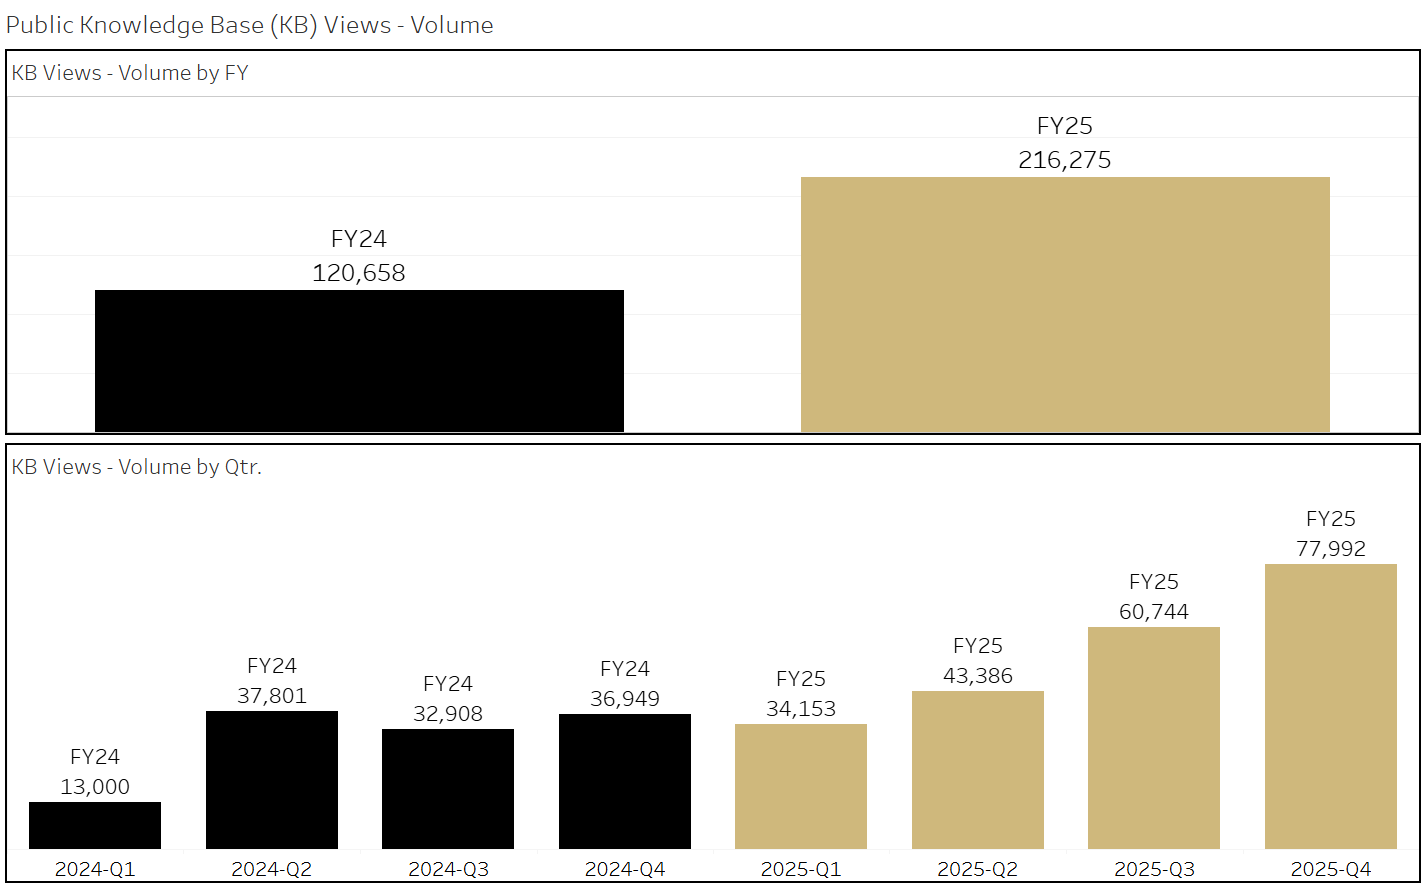
Click here for the Knowledge Base dashboard (to view you must be logged into your campus VPN).
Invoice & Form Submissions
Volume of Invoice/Form Submissions Received - FY23-25
Overall
- Volume - 14.6%
- Avg per month – 13,130
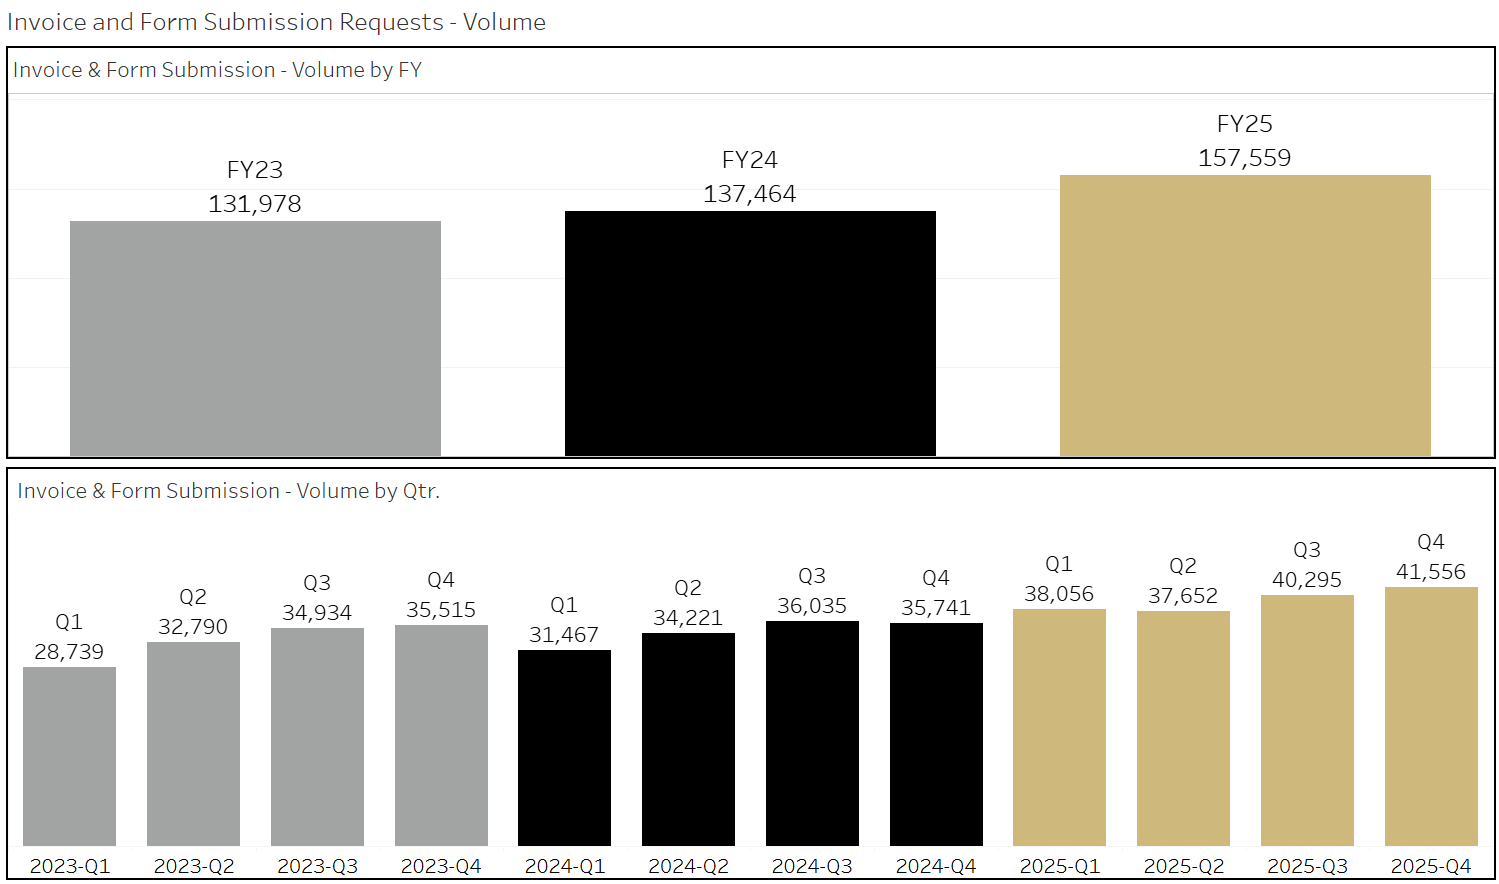
Click here for the Invoice and Form Submission dashboard (to view you must be logged into your campus VPN).
If you are having trouble opening a toggle please refresh your screen.
Interested in checking out more Tableau dashboards? Visit our Procurement Tableau Dashboard website.