


m-Fin EXPENDITURES CUMULATIVE BY MONTH CHARTS
Do you like reports that can cross fiscal years? Do you like columns for every month instead of just final amounts? Do you like bar charts? Try m-Fin EXPENDITURES CUMULATIVE BY MONTH CHARTS available now in Cognos QA. Use the Post Comment button at the bottom of this blog post to let me know if it is worthy of going to production. [08-Aug-2012 this report is now in production.]
If it is getting, say, ten fiscal years of data and you are interested really in only the last few, you can get it to run faster by providing a value for INITIAL FY.
Control of how far back to go is by fiscal year rather than by month because this was easier for us to do and we believe sufficiently useful.
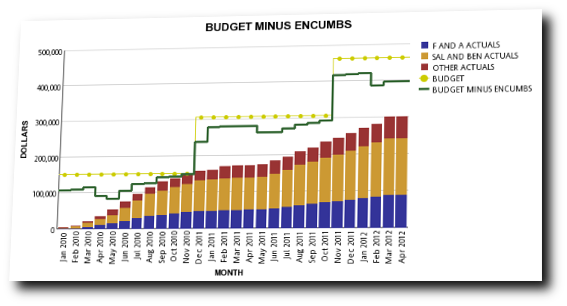
It reports expenditures and transfers and shows how these are tracking to budgets. It does not attempt to report assets, liabilities, revenues, or CU Foundation amounts. Therefore it can answer the ever-popular “just tell me how much I have available to spend” inquiry only when the answer does not depend on these other amounts. Not sure? Run m-Fin OPERATING SUMMARY.
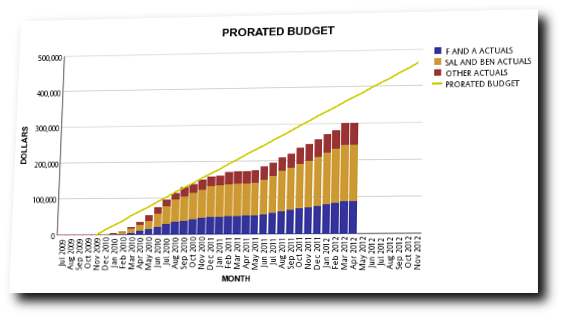
The PRORATED BUDGET chart plots your budget as a straight line over time, providing what some people call a burn rate analysis. The rest of the charts do the conventional (to CU) encumbrances style of analysis.
My thanks to the Boulder campus department of Electrical, Computer, and Energy Engineering’s Robert McLeod and Linda Rose for the inspiration and initial guidance on this report.