


There are several ways that data contained in reports run using Query Studio can be formatted. Data can be auto-summarized by grouping the data based on specific criteria, data can be sorted in ascending or descending order, data can be formatted to appear in separate sections, data can be filtered to only show specific information, and data can also be used to create customized calculations.
Grouping
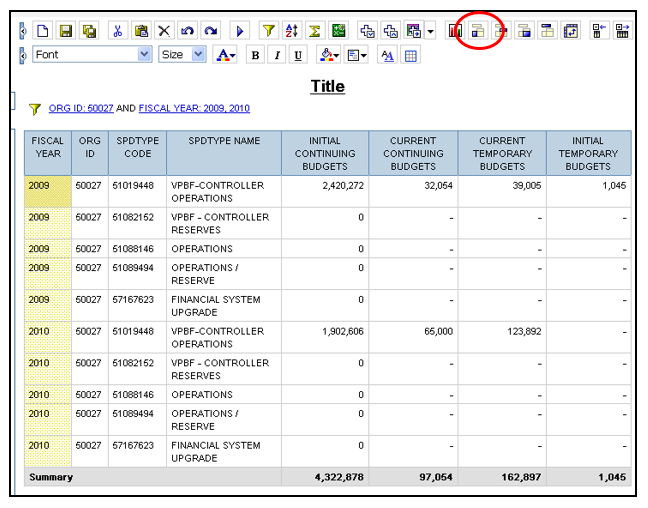
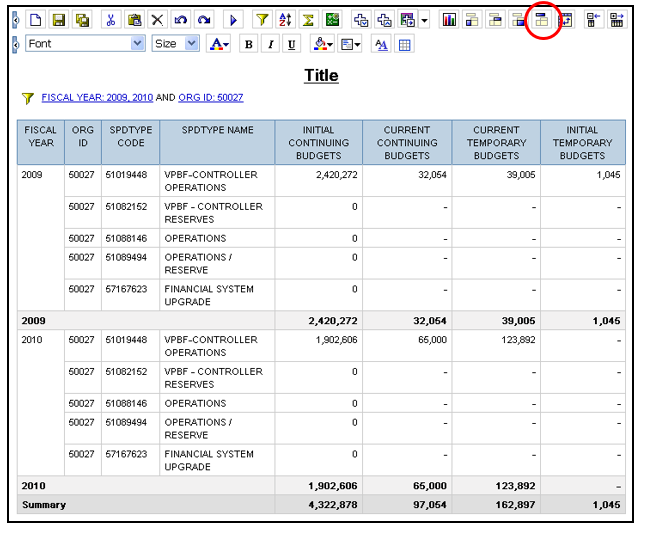
To auto-summarize data by grouping, click on the column that you would like to group. In this example, you will be auto-summarizing data by fiscal year. Once you have selected the data you would like to auto-summarize, click Group.
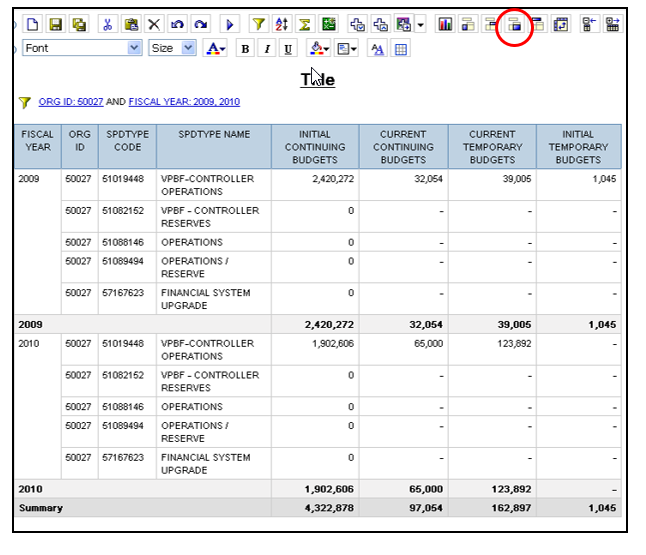
Your report will then be auto-summarized by fiscal year. To ungroup the data and remove the auto-summarization, select the desired column and then click Ungroup.
Sorting
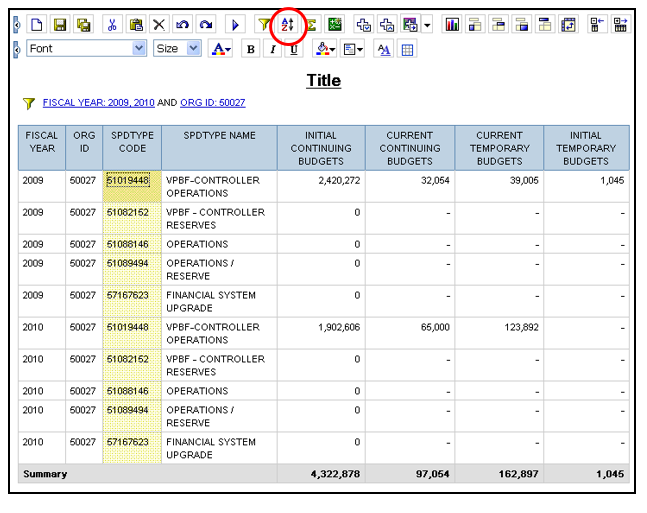
To sort data in either ascending or descending order, select the column that you would like to sort. In this example, you will be sorting your report based on SpeedType. Once you have selected the column you would like to sort, click Sort.
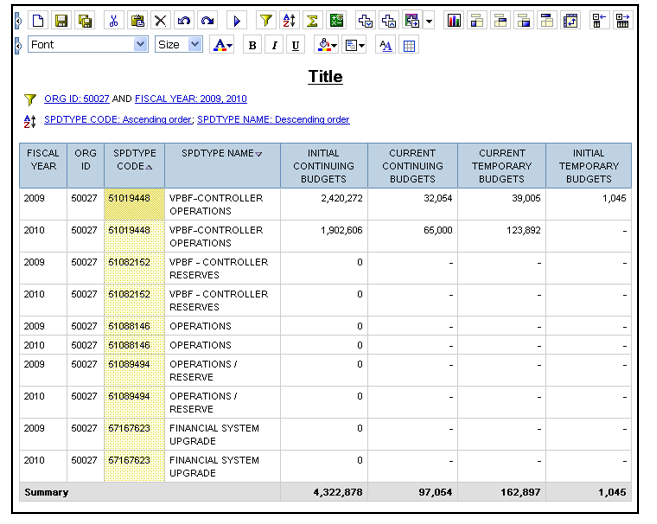
Your report data will now be sorted by SpeedType in ascending order.
Sections
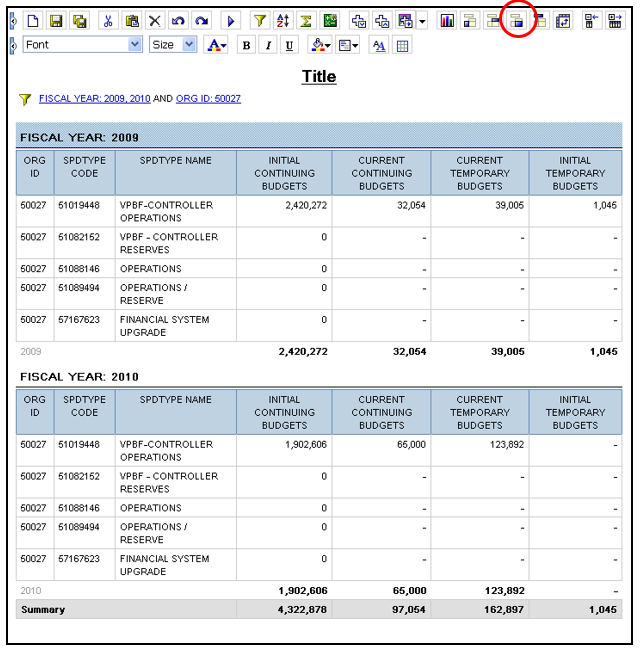
Once you have grouped and auto-summarized data on a report, the grouped data can then be split out into different sections. In this example, you will be creating separate sections of the report based on fiscal year. Select the column that is grouped that you would like to appear in separate sections.
Report data for each fiscal year will then appear in separate sections. To remove the sections, click on the Fiscal Year heading, and click Ungroup.
Filtering
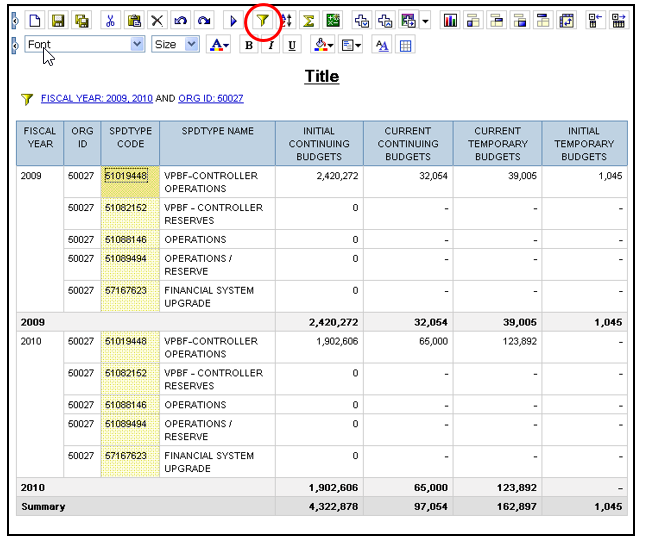
To filter report data to only show specific data, click on the column you would like to filter. In this example, you will be filtering the data based on SpeedType to only show one specific SpeedType. Select Filter.
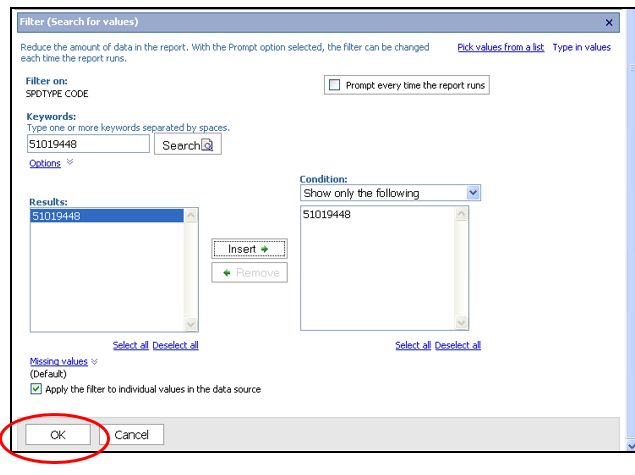
In the filter box, search for the SpeedType. In this example, search for 51019448 by typing 51019448 in the Keywords field and click Search. When the SpeedType appears, select it from the Results field, and click Insert. Click OK.
Your report will now only show information for that SpeedType.
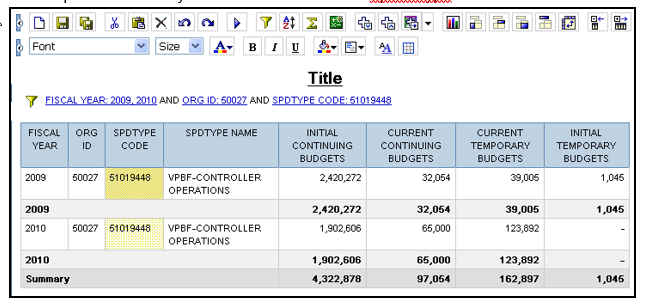
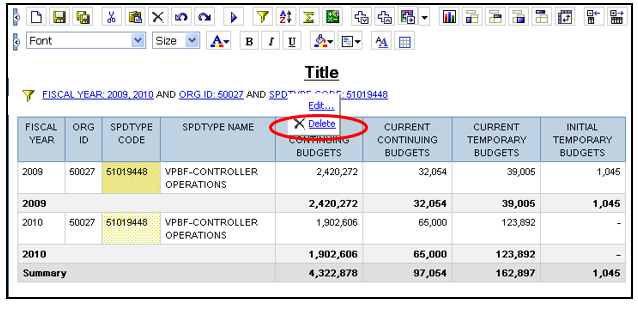
To remove a filter, right click on the filter under the title of the report, and click Delete.
Calculations
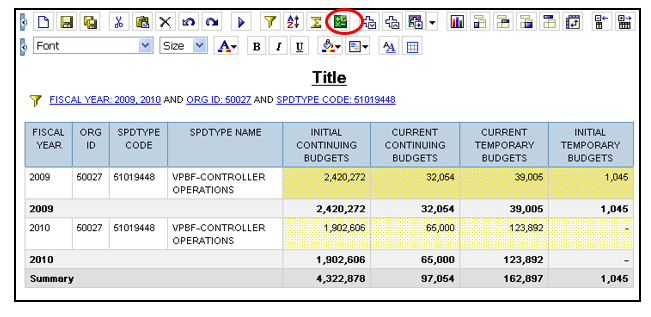
To perform a calculation on data within the report, select the data you would like to perform a calculation on. In this example, you will be calculating total budget. Select all four budget columns, and click Calculate.
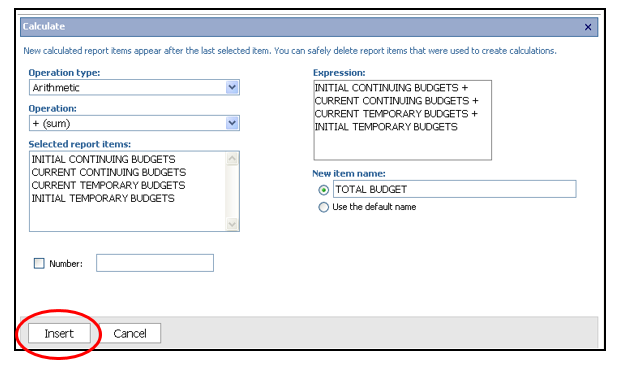
In this example, select the Operation Type of Arithmetic. To title the new column in which the total budget will appear, type the title in the New Item Name field. Click Insert.
The new column with the calculation will appear after the last column selected to perform the calculation.
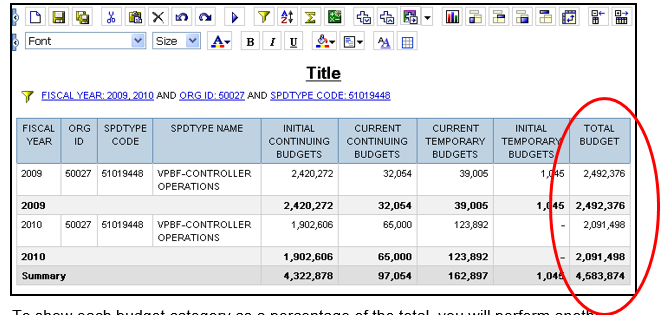
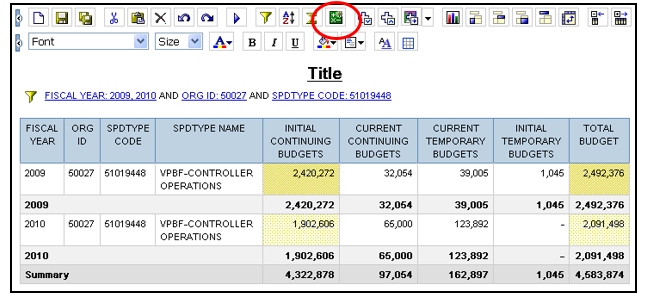
To show each budget category as a percentage of the total, you will perform another calculation. In this example, select Initial Continuing Budgets and Total Budget, and click Calculate.
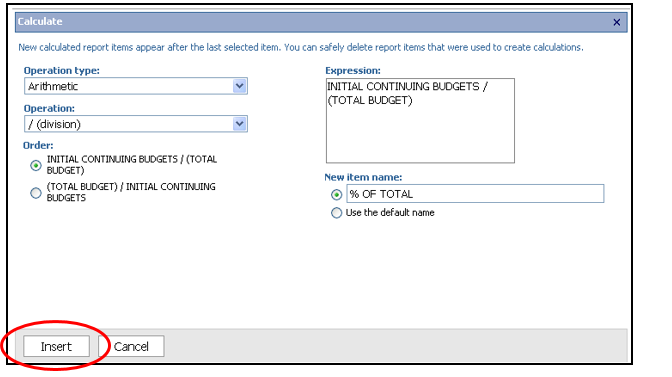
Change the Operation to /(division). Name the new column % OF TOTAL. Click Insert.
The new column will appear. To format the data as a percentage, visit the learning resource Query Studio – Formatting a Report.
