When creating a report within Query Studio, it is important to preview reports without data, or with limited data, to limit the time it takes to build the report. To see report preview options that are available as you are building your report, select Run Report from the Main Menu.
- Run with All Data will populate your report as you build your report by adding report category columns and rows to it.
- Preview with Limited Data will partially populate your report as you build your report by adding category columns and rows to it.
- Preview with No Data will populate your report with report category column headings and generic report information, such as “1234” for dollar amount.
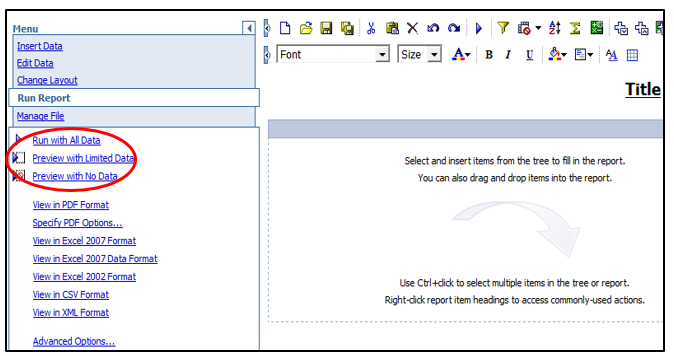
In this example, select Preview with No Data
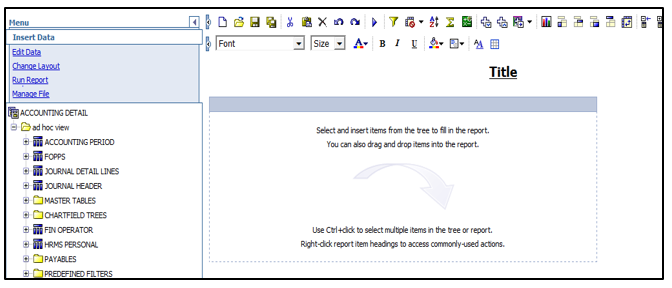
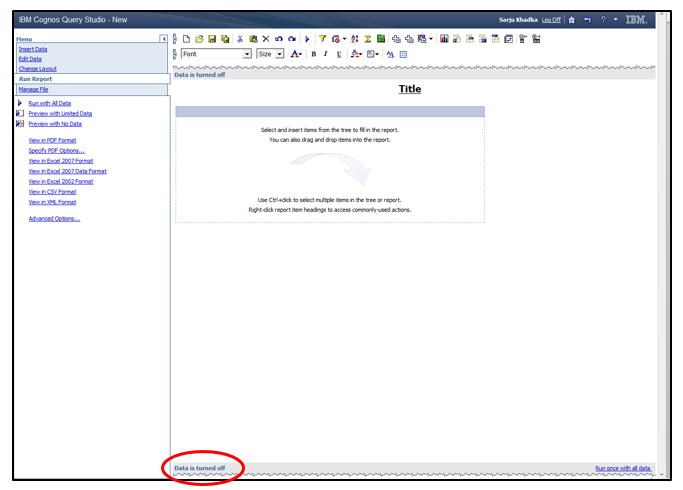
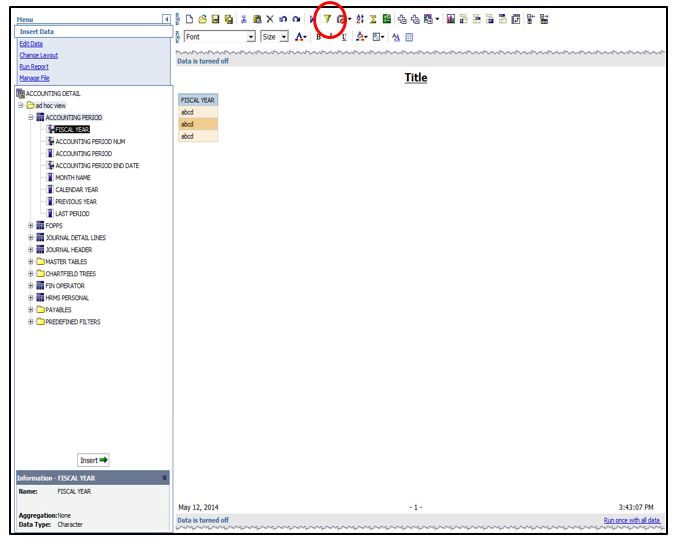
To begin creating your report, click on Insert Data. All of the report categories will appear. Also note that the bottom of your screen indicates to you that Data is turned off.
In this example, you will be building a report for a specific Organizational Unit that will show budget information for FY09 and FY10. To add a report category to your report, expand the tree menu and select the category. Add it to your report by double-clicking on the report category, dragging and releasing the report category in the report area, or selecting the report category and click Insert at the bottom of your screen. In this example, expand Accounting Period and select Fiscal Year. Double-click on Fiscal Year, or select it and click Insert.
The Fiscal Year will now appear as a column on your report. To add a Prompt to your report to only run the report for specific Fiscal Years, click on the Fiscal Year column, and then select the Filter icon.
Note: For further information on filtering data, visit the learning resources Query Studio – Icons and Query Studio – Sorting, Grouping, and Filtering Data.
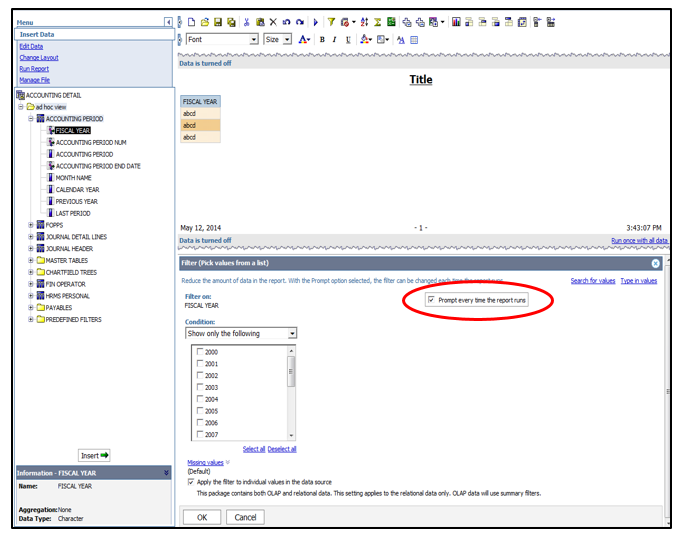
When the Filter options appear, check the box next to Prompt every time the report runs. Click OK.
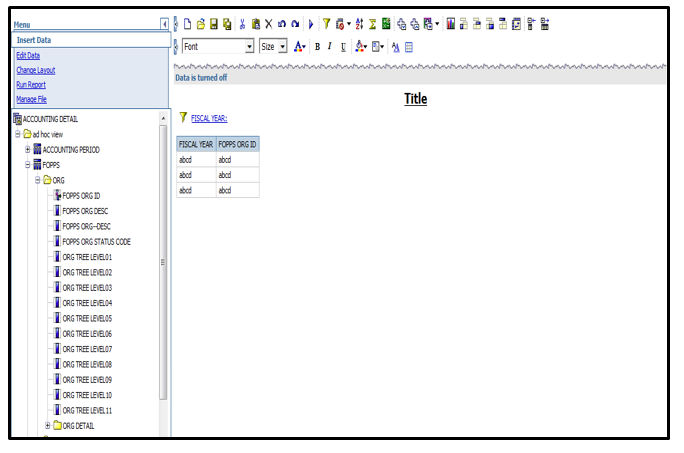
Now you will want to add the Org ID category to your report. Expand the menu tree under FOPPS to Org, and then select FOPPS Org ID. Add it to your report by double-clicking on it, dragging and releasing the data item or selecting it and clicking Insert. To limit the data on the report to a specific Org ID, add a filter to the Org ID column by selecting the Org ID column, and selecting the Filter icon.
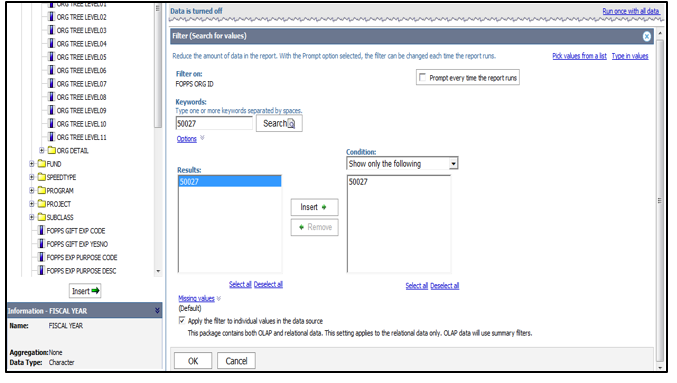
When the filter options appear, search for Org ID 50027 by typing 50027 in the Keywords field and clicking Search. Select Org ID 50027 from the Results field and click Insert. Click OK.
Continue creating your report by adding the following categories:
- Detail FOPPS/SpeedType/SPDTYPE CDE
- Journal Detail Lines/Budget Amounts/Initial Continuing Budgets
- Journal Detail Lines/Budget Amounts/Current Continuing Budgets
- Journal Detail Lines/Budget Amounts/Initial Temporary Budgets
- Journal Detail Lines/Budget Amounts/Current Temporary Budgets
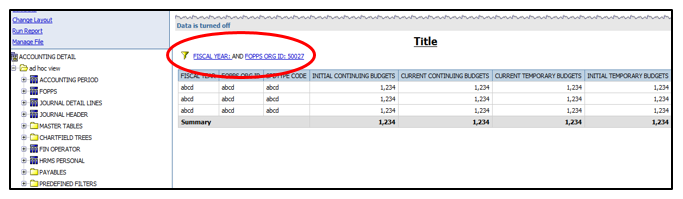
Note that all columns with prompts/filters are listed at the top of your report.
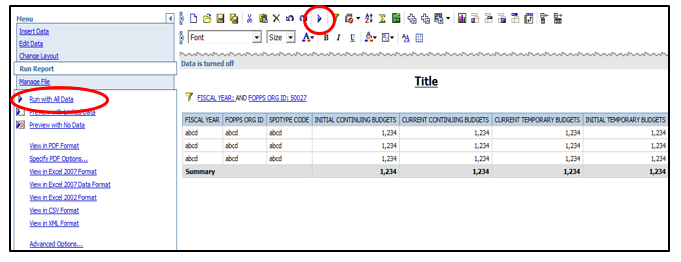
To run your report, either click on the icon, or click Run Report from the Menu, and select Run with all Data.
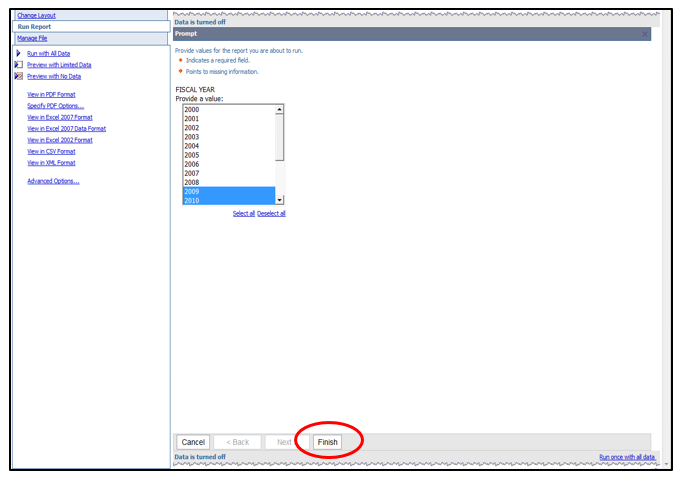
The prompt for Fiscal Year will appear. Select 2009 and 2010, then click Finish.
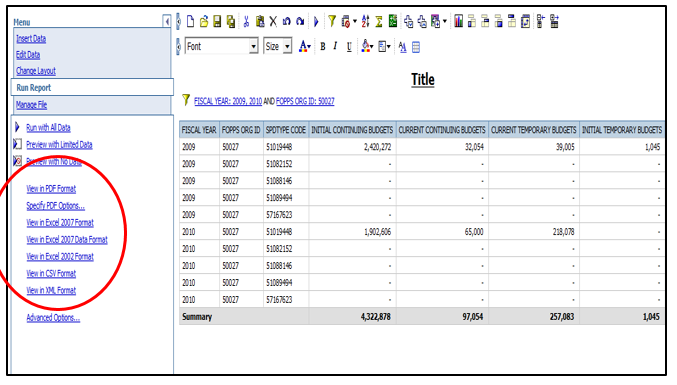
Your report will appear. There are also several output options for your report.
- View in PDF Format
- View in Excel Format
- View in CSV Format
- View in XML Format