


Back to Budget and Finance Office or CU Data Made Simple
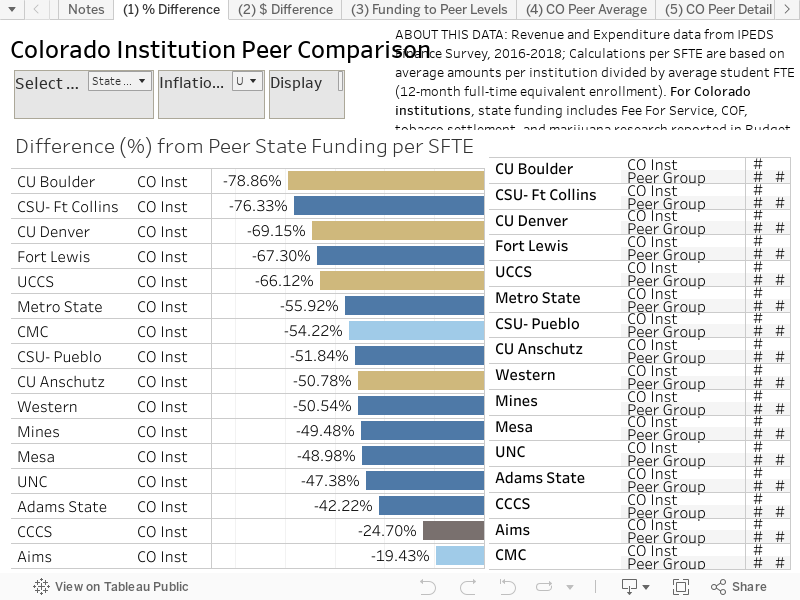
ABOUT THIS VISUALIZATION: This data visualization summarizes state funding and tuition revenue per student compared to peers. The purpose of this analysis is to demonstrate the variance of revenue sources of Colorado public institutions compared to ten peer institutions assigned by the Colorado Department of Higher Education. This data visualization was created by the CU System Office of Budget and Finance. For additional details, see the Notes tab within the visualization.
ABOUT THIS DATA: Revenue and Expenditure data from IPEDS Finance Survey, 2016-2018; Calculations per SFTE are based on average amounts per institution divided by average student FTE (12-month full-time equivalent enrollment). For Colorado institutions, state funding includes Fee For Service, COF, tobacco settlement, and marijuana research reported in Budget Data Books actuals. Peer list based on CDHE's 2020 peer selections. For additional details, see the Notes tab within the visualization.
Should you have questions or comments on this analysis, please contact IR@cu.edu.
Visualization is formatted for 1600x900 resolution. If you are using a smaller screen, use this link hosted on tableau.com.
Back to Budget and Finance Office