


Back to Budget and Finance Office or CU Data Made Simple
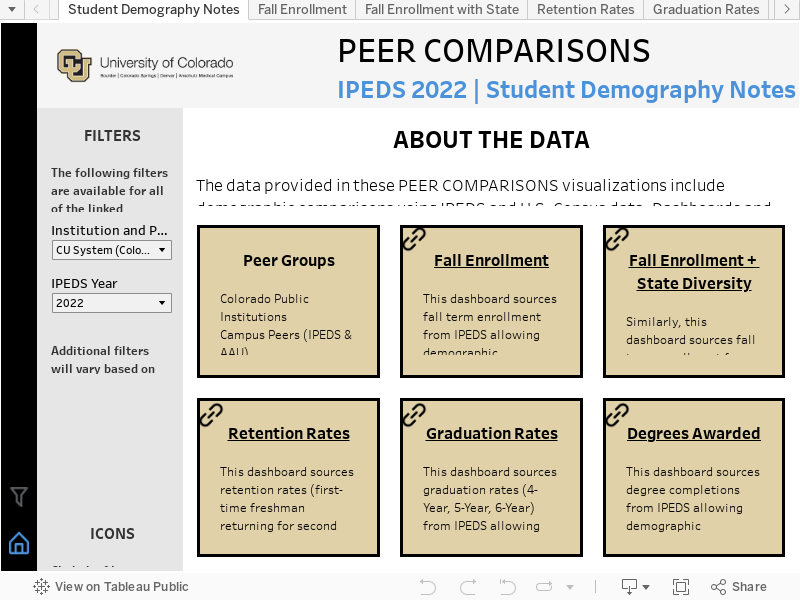
ABOUT THIS VISUALIZATION: Based on IPEDS and US Census data, this visualization allows for comparing demographic diversity of CU campuses to multiple peer groups across several data sources including Fall Enrollment, Graduation Rates, and Degree Completions. A comparison of institutional demography to state demography is included. Additionally, Freshman Retention Rates are also included although demographic detail is not collected by IPEDS. This data visualization was created by the CU System Institutional Research. Additional details are provided within the visualization.
Should you have questions or comments on this data, please contact IR@cu.edu.
Visualization is formatted for 1600x900 resolution. If you are using a smaller screen, use this link hosted on tableau.com.
Back to Budget and Finance Office