Deliverability - Complaint Rate
Wondering about how successfully your emails are being delivered to different email domains or which domains generate the highest number of spam complaints? Marketing Cloud's Deliverability - Complaint Rate report can help. The report documents the complaint rate for the top 15 domains for the last 2 weeks, but you can adjust the report filters as desired to capture additional data.
NOTE: This wiki assumes that you've already read Discover Reports in Marketing Cloud and know how to access Discover Reports.
Launching the Deliverability - Complaint Rate Report
To launch your report, locate the report name Deliverability - Complaint Rate and click the Create button.

The report will automatically populate using all of the data in your business unit based on the default filters contained within the report logic.
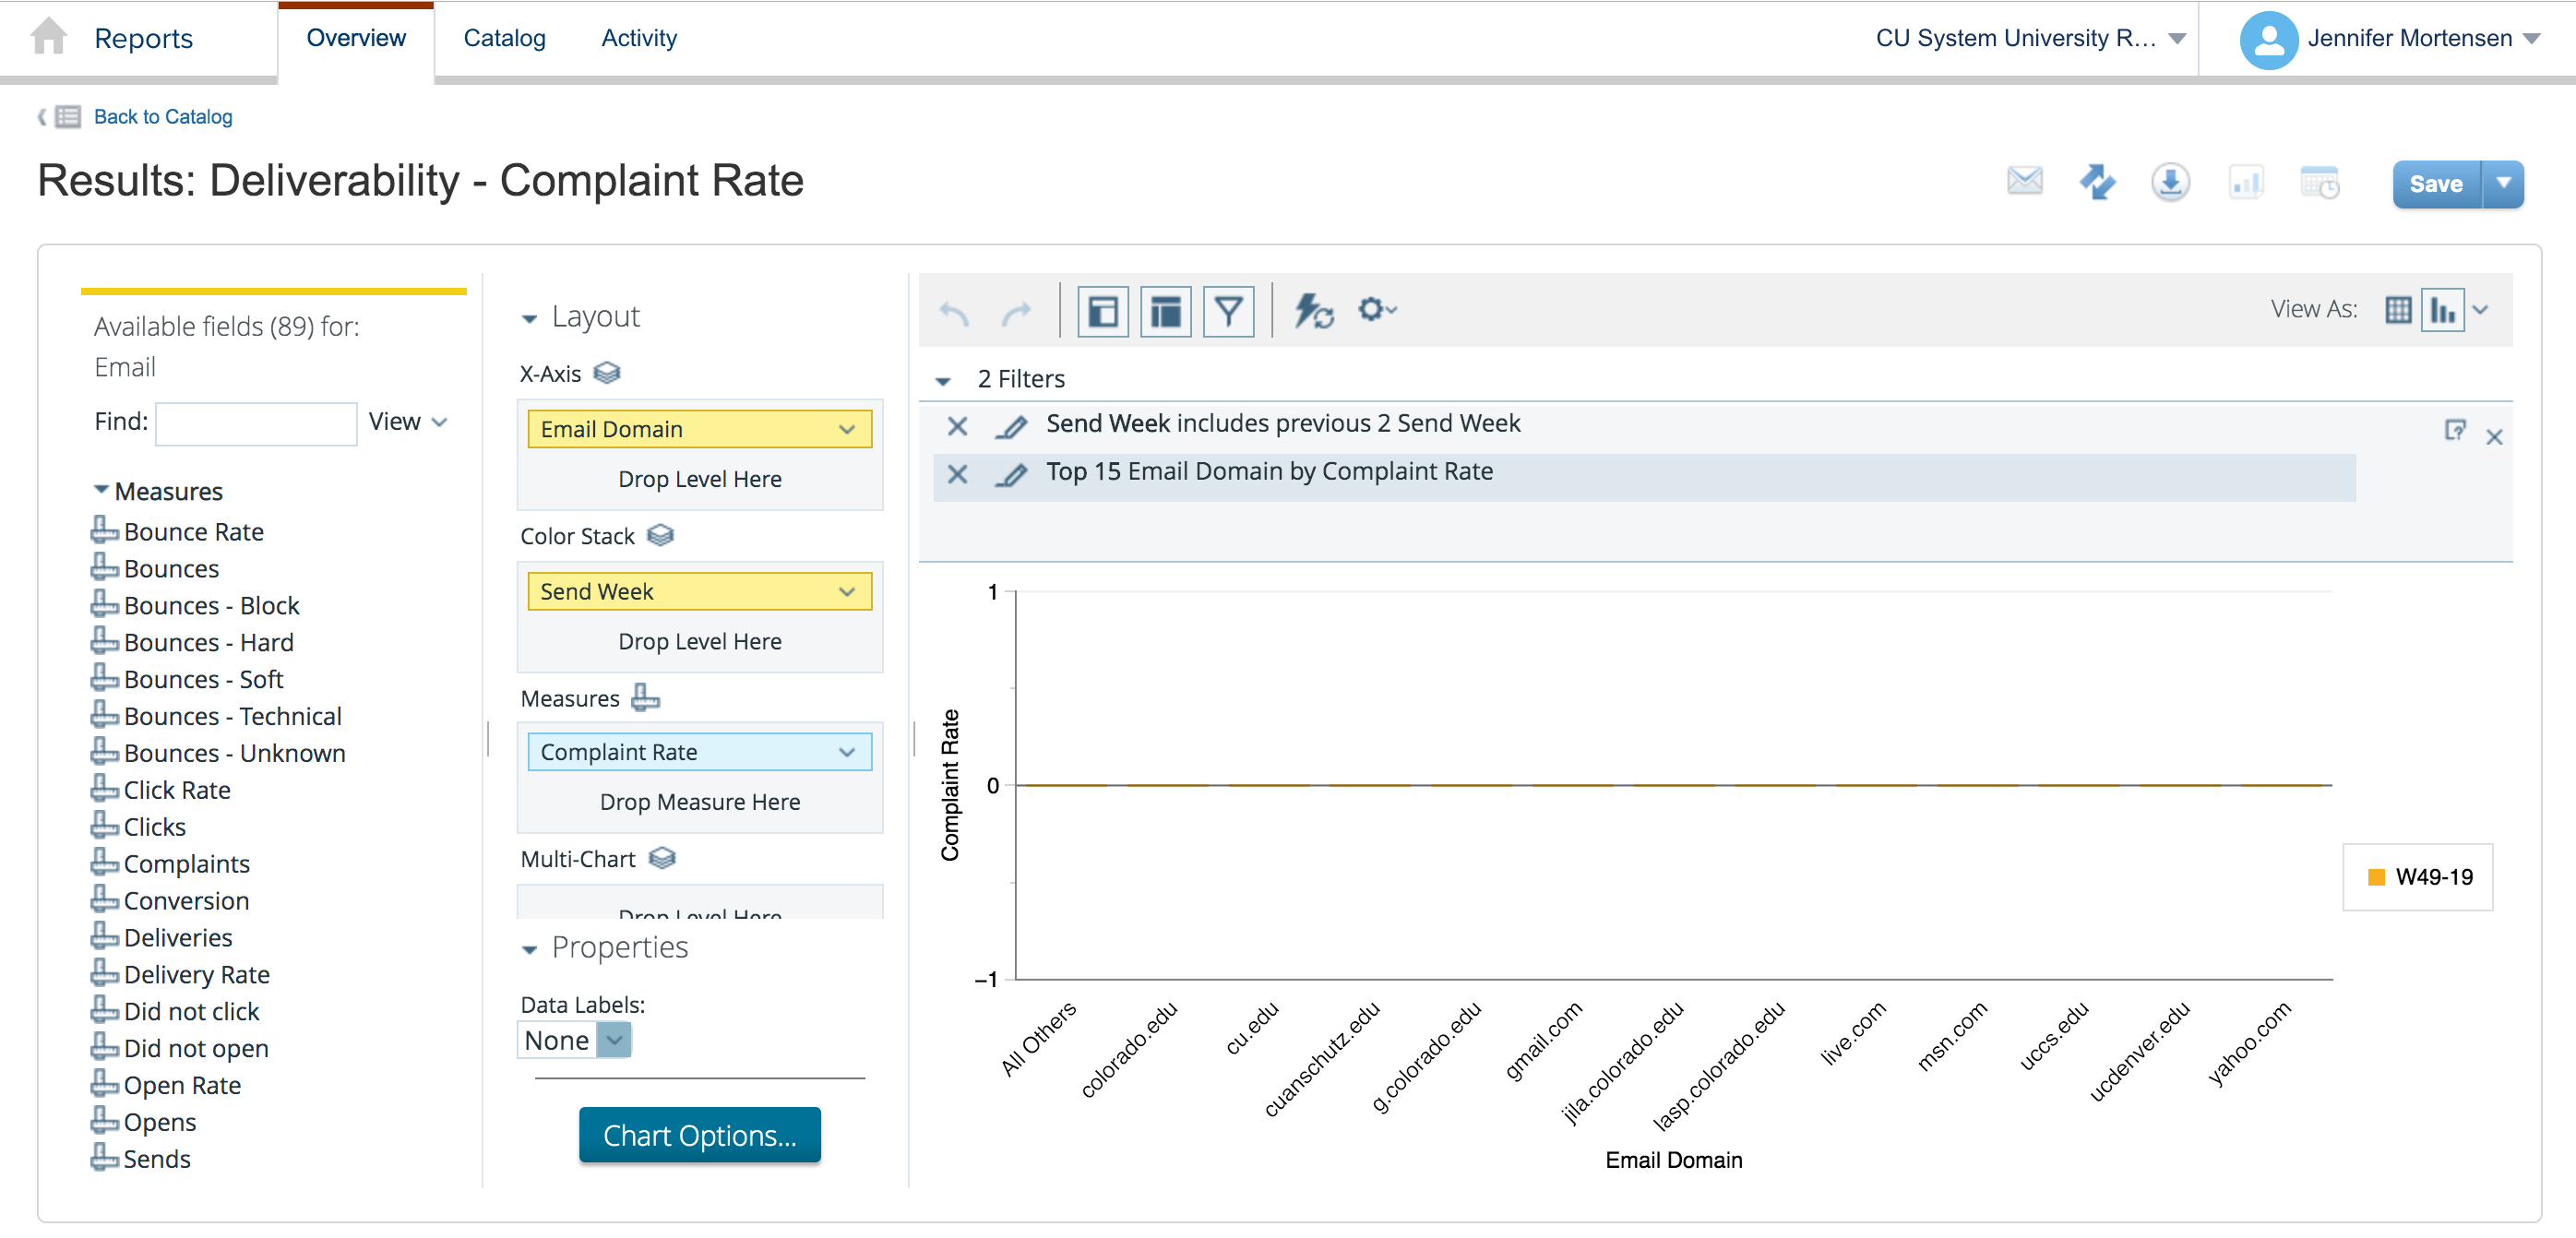
If the information you see when your default report populates is a bit lacking (as in the example above), don't worry. Luckily, Marketing Cloud allows you to filter your report criteria to get more meaningful information about specific email sends.
For the purposes of this example, we will be using the Deliverability - Complaint Rate report to measure deliverability rates of less than 90% to specific domains for the president's newsletter.
Report View
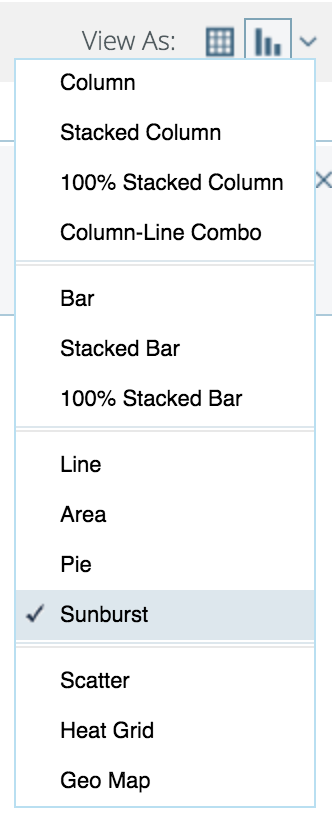
First, select the type of report layout you want to create using the View as Table or Chart options in the upper right corner of the screen. Select Chart and then click the drop down arrow next to the chart icon. Select Sunburst.
Customizing Your Report with Filters
Once your default report populates, you'll be presented with three key areas that allow you to customize the data generated:
- Available Fields: A list of fields you can use to display or filter email send information from your business unit. You can drag and drop available fields into both the layout and filter areas.
- Layout: Options for the X and Y axes and associated measurements that allow you to customize the data your report measures and how it is displayed.
- Filters: Options to specify filter criteria based on traditional filter logic such as "is equal to, "is not equal to," "contains," "does not contain," etc.
Layout
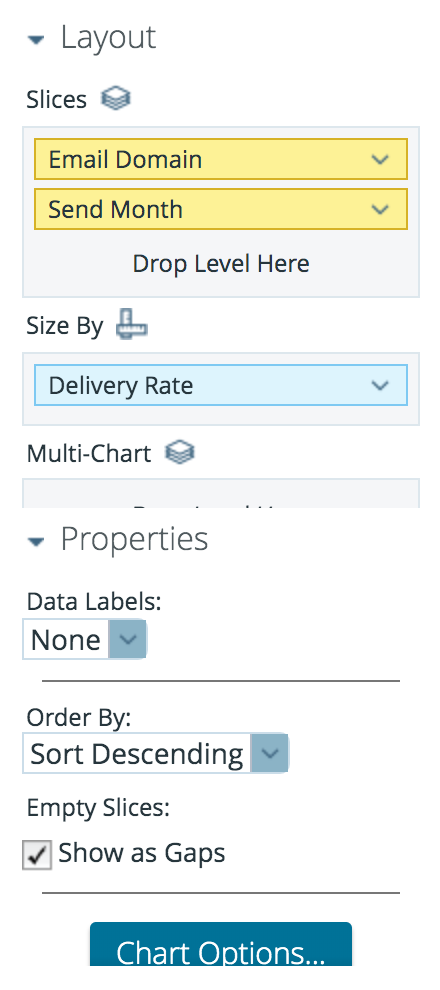
Set your layout criteria as follows:
- Slices: Drag Email Domain and Send Month from Available Fields and drop in Slices. Remove other criteria listed by default by clicking the drop down arrow next to them and selecting Remove.
- Size By: Drag Delivery Rate from Available Fields and drop it in Size By. Remove other criteria listed by default by clicking the drop down arrow next to them and selecting Remove.
Filters
Since the layout options alone don't limit our email sends to a specific set of criteria, we can use filters to further narrow our view. First, drag Email Domain from Available Fields to Filters. A window will open that allows you to specify the filter logic. In this case, we will select Match a Specific String and set the logic to doesn't contain @cu.edu, @uccs.edu, @colorado.edu, @ucdenver.edu, and @cuanschutz.edu since we want to investigate email domains outside of CU's control.
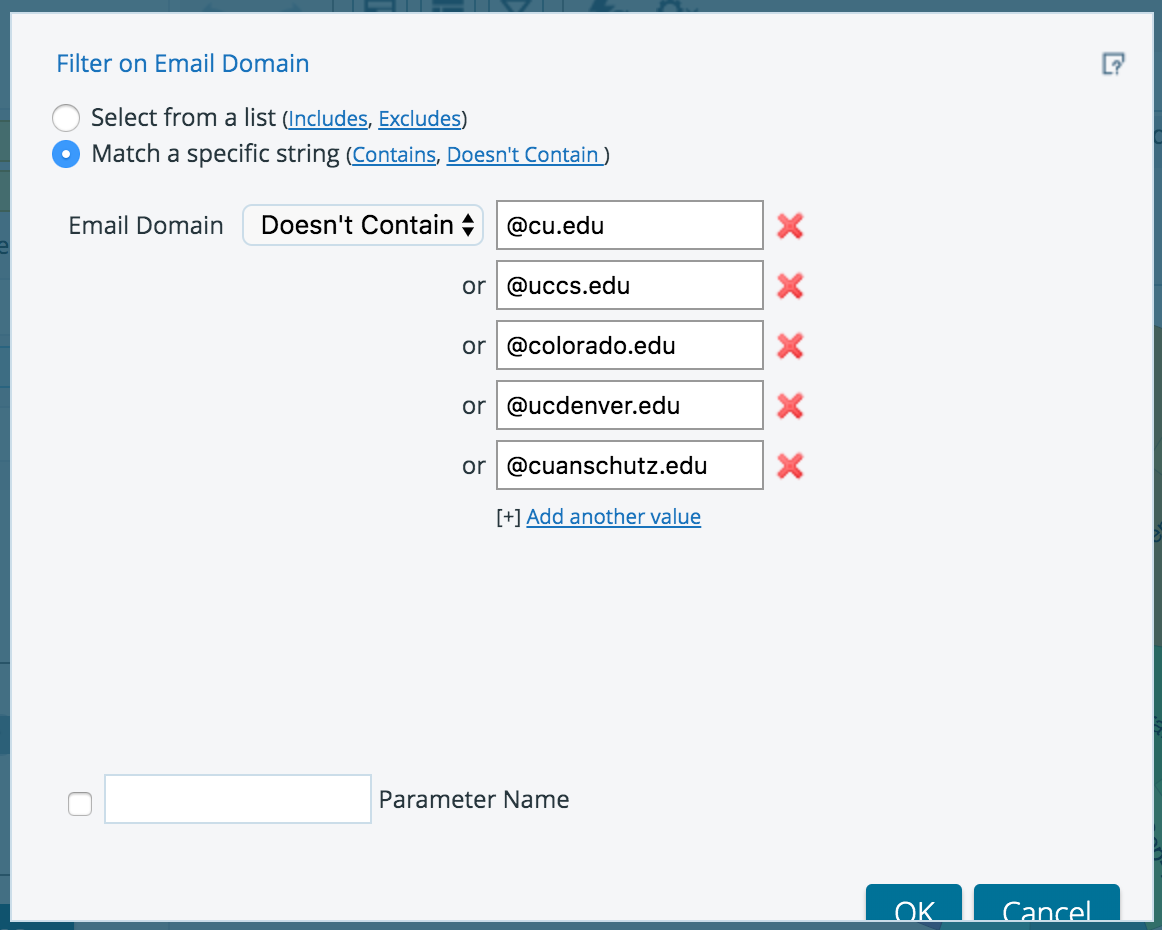
Click OK when you are finished. Your report will automatically refresh.
In this case, we also want to include two additional filters for email name contains and delivery rate is less than, so we will repeat the process above. Drag Email Name from Available Fields and drop it in Filters. When the filter logic box appears, set your filter logic to Match a Specific String - contains prez, pres, president, presidents. Next, drag Delivery Rate from Available Fields and drop it in Filters. This filter allows us to set a numeric value, and we will choose delivery rate = less than 90%.
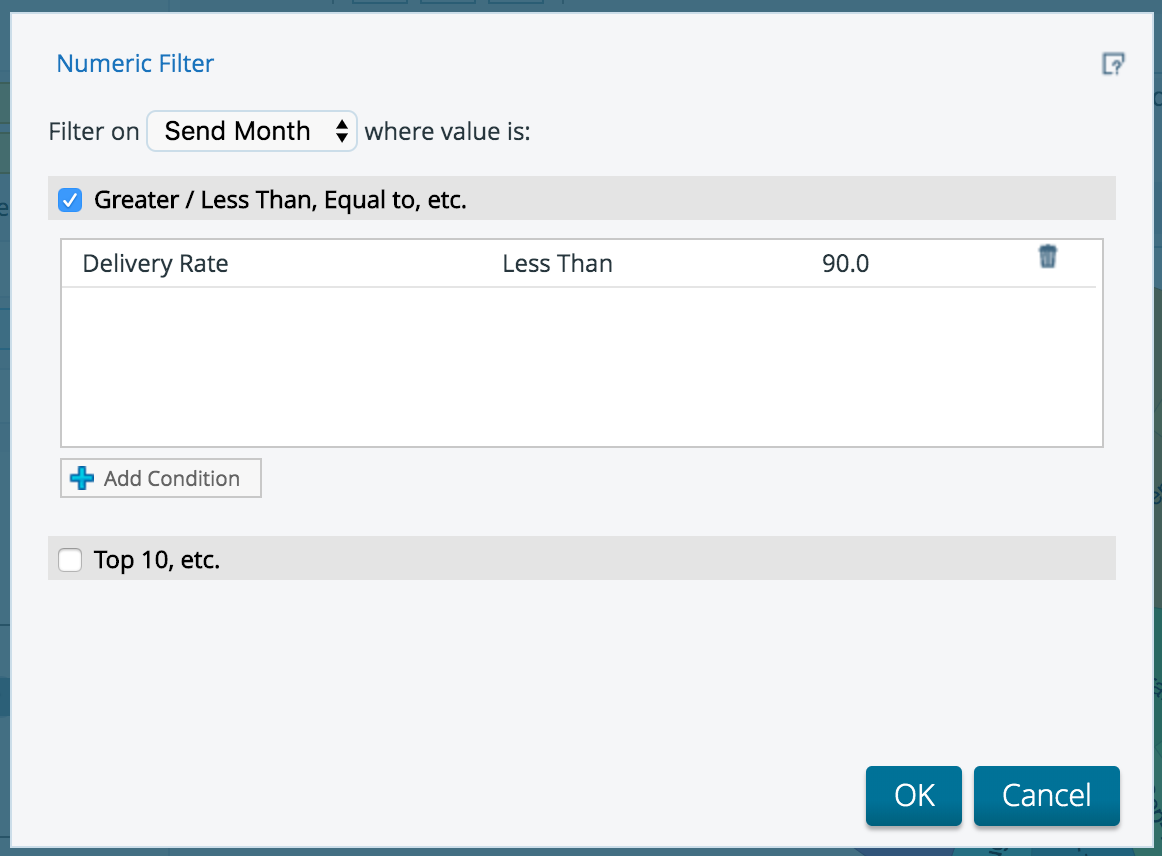
Click OK when you are finished. Your report will automatically refresh, and your final filter logic results will contain criteria for Email Domain, Email Name, and Delivery Rate.

Your final report will populate based on the criteria you entered and might look something like the screen shot below depending on the filters you are using.
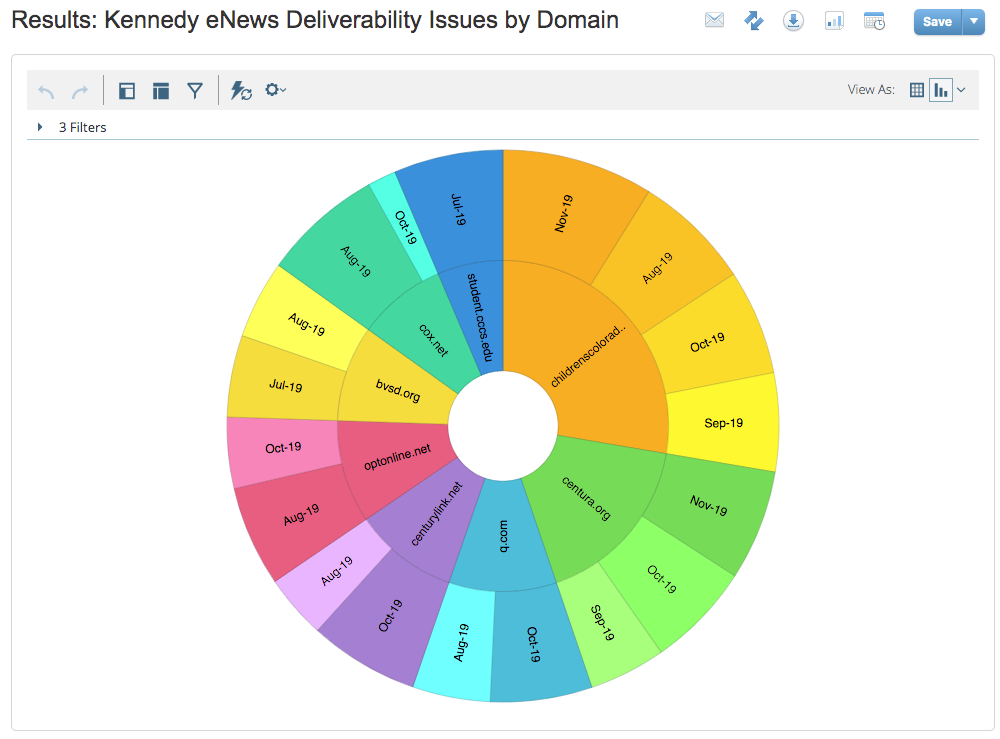
You can then save your report to access it again in the future or schedule updates to run automatically. See Discover Reports in Marketing Cloud for more information.
This report shows us that the majority of our deliverability issues have occurred with the domain @childrenscolorado.org, followed by @centura.org.


