


Back to Budget and Finance Office or CU Data Made Simple
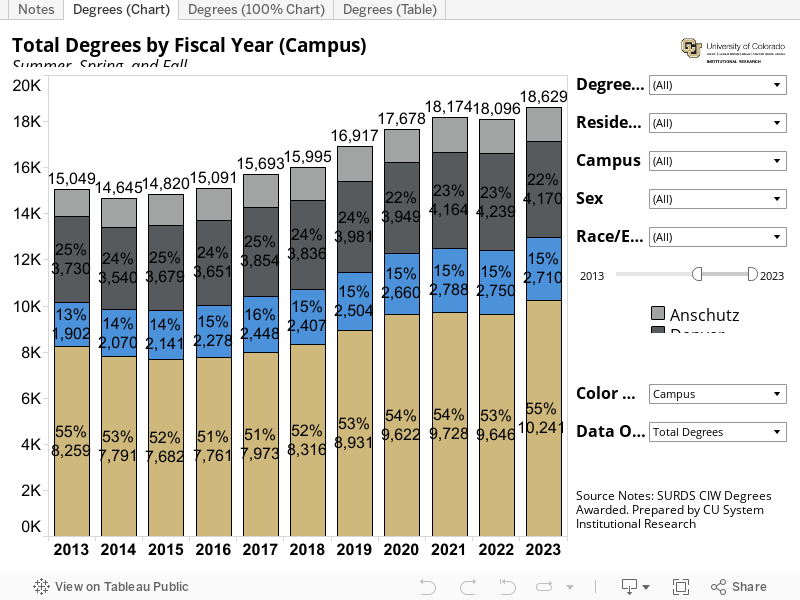
ABOUT THIS VISUALIZATION: This data visualization summarizes degrees awarded to CU students, by fiscal year. Data can be viewed by campus, degree level, residency, race/ethnicity, sex, and CIP cluster (including STEM designation). This data visualization was created by the CU System Institutional Research. Additional details are provided within the visualization.
Download as an excel or pdf file.
Should you have questions or comments on this data, please contact IR@cu.edu.
Visualization is formatted for 1600x900 resolution. If you are using a smaller screen, use this link hosted on tableau.com.
Back to Budget and Finance Office